
Previous issues
- Page Path
- HOME > Articles and Issues > Previous issues
- Volume 3(4); December 2021
-


Articles
- Construction of Topographic/Hydrologic Data using DEM and its Service 2
- Saro Lee, Minju Kim
- GEO DATA. 2021;3(4):1-10. Published online December 31, 2021
- DOI: https://doi.org/10.22761/DJ2021.3.4.001

- 941 View
- 67 Download
-
 Abstract
 PDF
PDF - In addition to a total of 20 types of topography/moisture analysis maps that have already been built using a digital topographic model (DEM), in this study, a total of 32 types including 26 types of topographic analysis diagrams and 6 types of hydrological analysis diagrams were performed through various topography/hydraulic analysis. Additional species were built. As with the existing established data, the construction range is the whole of South Korea, the resolution is 30 m, and the coordinate system is UTM-K coordinates. The constructed data format is provided in three formats: ASCII, ARCGIS GRID, and GEOTIFF. All these topographic / hydrological analysis data can be downloaded free of charge from the Environmental Big Data Platform (www.bigdata-environment.kr).
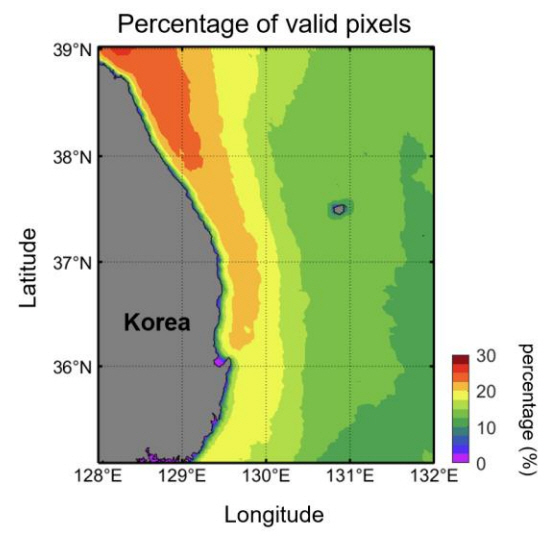
- Reconstruction of Satellite Chlorophyll-a Concentration in the Southwestern East Sea using Imputation Method
- Jinku Park, Sungjae Lee, Hyun-Cheol Kim
- GEO DATA. 2021;3(4):11-17. Published online December 31, 2021
- DOI: https://doi.org/10.22761/DJ2021.3.4.002
- 255 View
- 9 Download
-
Abstract
PDF
- The chlorophyll-a concentration (CHL) data observed with the ocean color sensors have been widely used in the various studies related to phytoplankton. However, irregularly distributed missing data induced by clouds, a unique nature of optics, can cause large uncertainty, and a solution to this missing issue has been continuously demanded until now. We investigated the applicability of the data interpolating empirical orthogonal function and evaluated the reconstruction results in the southwestern East Sea. A total of 311 decomposed modes were used, showing a coefficient of determination of about 0.86 and a root mean square error of 0.37 mg m−3, compared to the truth data. Overall, it was confirmed that the observed CHL was overestimated compared to the reconstructed CHL when the spatio-temporal average was taken.
- A Preliminary Study to Determine the Hydrogen and Oxygen Isotopic Compositions of Natural and Bottled Water using High Sensitivity Isotope Ratio Mass Spectrometry
- Hyeongseok Song, Hui Je Jo, Dongwoo Yang
- GEO DATA. 2021;3(4):18-27. Published online December 31, 2021
- DOI: https://doi.org/10.22761/DJ2021.3.4.003

- 353 View
- 15 Download
-
Abstract
PDF
- In this study, we introduce the stable isotopic results of water using a recently installed high sensitivity isotope ratio mass spectrometry (HS-IRMS) system at the Korea Institute of Geoscience and Mineral Resources (KIGAM). As a result of analytical method validation through an international proficiency test, the 2020 WICO (Water Isotope Inter-Comparison), organized by the International Atomic Energy Agency, the KIGAM IRMS laboratory showed satisfactory performance. Furthermore, stable isotopic compositions of bottled water samples from South Korea were measured using the HS-IRMS with a high temperature conversion elemental analyzer, and this method was re-validated and confirmed by a comparison with stable isotope results obtained using an equilibrium method.
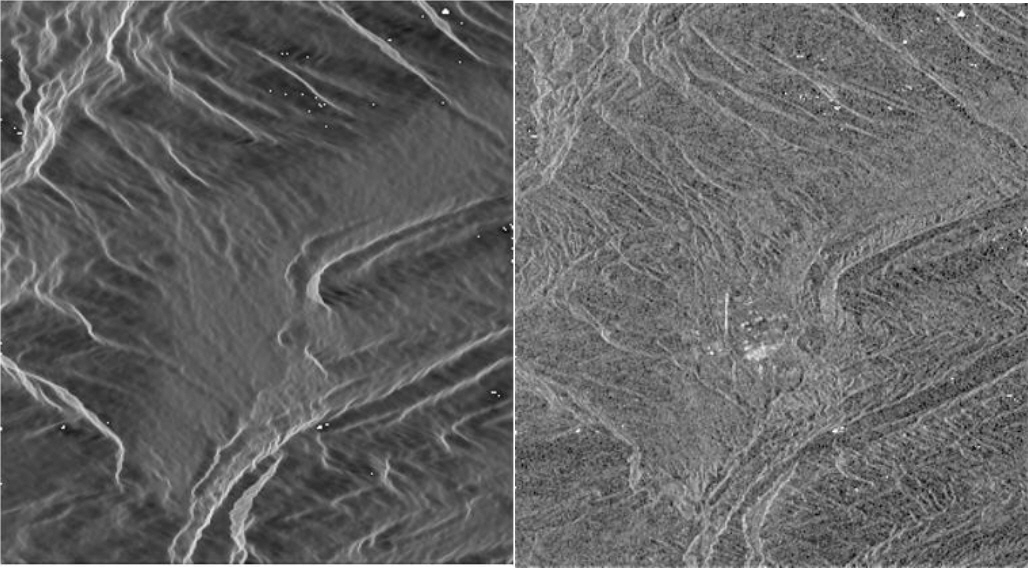
- Radiometric Distortion Corrected Radar Backscattering Coefficient Data over Ilam, Iran using Kompsat-5 SAR Image
- Dochul Yang
- GEO DATA. 2021;3(4):28-31. Published online December 31, 2021
- DOI: https://doi.org/10.22761/DJ2021.3.4.004
- 273 View
- 6 Download
-
Abstract
PDF
- Flattening gamma naught was calculated using Korea Multipurpose Satellite 5 (KOMPSAT-5, K5) by correcting the radiometric distortion caused by geometric distortion over Ilam, Iran. The flattening gamma naught is not only the SAR core observation of Analysis Ready Data (ARD), which is utilized for artificial intelligence and big data, but also the basis for all fields of application that use the SAR brightness by providing the backscattering values only from surface characteristics. The flattening gamma naught data is provided with the same resolution as that of the K5 SAR image, so the data over the Ilam, Iran have the spatial resolution of the K5 Wide Swath mode of 20 m. Shuttle Radar Topography Mission (SRTM) DEM with a resolution of 30 m was oversampled to generate the flattening gamma naught, and shadow areas where flattening gamma naught generation was not possible were identified using GIM layer information provided with the K5 image. In order to determine the reliability of the calculated flattening gamma naught, histogram analysis and tendency according to the incident angle were investigated, and the performance was verified by comparing it with other backscattering coefficients. Details of the algorithm and procedure are presented in previous studies and reference papers.
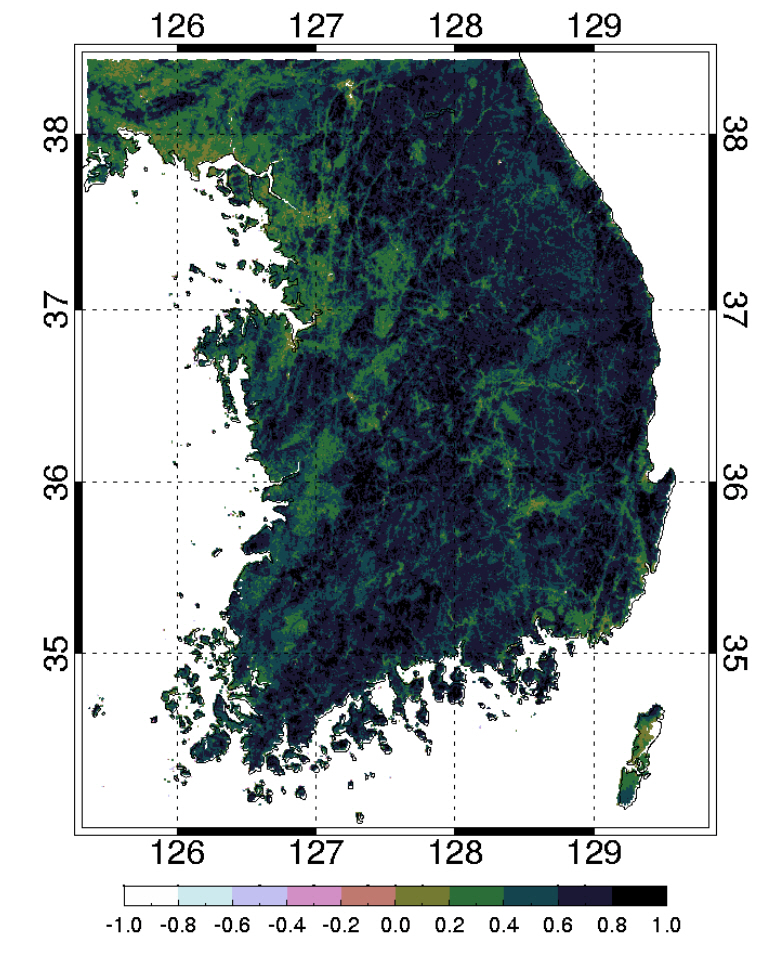
- Expand and Renewal of Analyzed Satellite Image and Service
- Young-Woong Yoon, Che-Won Park, Sung-Hyun Gong, Won-Kyung Baek, Hyung-Sup Jung
- GEO DATA. 2021;3(4):32-48. Published online December 31, 2021
- DOI: https://doi.org/10.22761/DJ2021.3.4.005

- 701 View
- 19 Download
-
Abstract
PDF
- In this study, additional satellite analysis data in 2019, 2020, and 2021 were generated using Landsat-8 and Sentinel-2 satellite images. We additionally employed 19 types of satellite analysis methods, and generated totally 57 cases of satellite analysis data for three years. In addition, 34 types of satellite analysis data were updated using 2021 satellite data. In conclusion, a total of 91 cases of satellite analysis data were generated. The coverage of the study is the entire South Korea. The spatial resolution and the coordinate system were 30 m and UTM-K (EPSG: 5179) respectively. The products are provided as the entire South Korean and regional data, respectively. In addition, it is provided in three data types: ASCII, ArcGIS Grid, and GeoTIFF as same as last distribution. All satellite image analysis data can be downloaded free of charge from the Environmental Big Data website (www.bigdata-environment.kr), an environmental business big data platform.
- Distribution Data of Freshwater Fish in Korea Islands
- Hee nam Yoon, Man-Seok Shin
- GEO DATA. 2021;3(4):49-56. Published online December 31, 2021
- DOI: https://doi.org/10.22761/DJ2021.3.4.007

- 448 View
- 21 Download
-
Abstract
PDF
- This study analyzed the status of distribution of freshwater fish species in 73 islands of South Korea, using the third National Ecosystem Survey data. As a result of the survey, 62,265 individuals of 11 orders, 24 families, and 79 species, including 16 endemic species of the Korean Peninsula, three invasive alien species, and one endangered species, were identified. The dominant species were Carassius auratus and Oryzias latips, accounting for 14.1% and 13.2% of the total abundance, respectively.
- Bioclimatic Variables in South Korea under Climate Change SSP Scenario
- Man-Seok Shin, Heenam Yoon
- GEO DATA. 2021;3(4):57-65. Published online December 31, 2021
- DOI: https://doi.org/10.22761/DJ2021.3.4.008

- 428 View
- 25 Download
-
Abstract
PDF
- In this study, bioclimatic variables in 2100 were created by using 7 Global Climate Models (GCMs) predicted by the Shared Socioeconomic Pathways (SSP) scenario. Using the dismo package of the R program, 19 bioclimatic variables of the year 2100 were generated. The annual mean temperature in 2100 has risen the most compared to the present (2000). Bioclimatic variables can be mainly used in the Species Distribution Model and Ecological Modeling to predict the distribution of species.
- The Map Data of BRDF-Adjusted Surface Reflectance from GOCI Geostationary Satellite Imagery over Korean Peninsula
- Jong-Min Yeom
- GEO DATA. 2021;3(4):66-70. Published online December 31, 2021
- DOI: https://doi.org/10.22761/DJ2021.3.4.006
- 244 View
- 7 Download
-
Abstract
PDF
- In this study, the spatial maps of the BRDF (Bidirectional Reflectance Distribution Function) adjusted surface reflectance (SR) were estimated by using the Geostationary Ocean Color Imager (GOCI) mounted on the Communication, Ocean and Meteorological Satellite (COMS) over the Korean Peninsula. The BRDF-Adjusted surface Reflectance (BAR) is a more effective indicator that not only quantitatively identifies the growth characteristics of vegetation, but also corrects the bidirectional error in the time series observation characteristics, because the surface reflectance is changed according to the solar altitude during the daytime period. Therefore, this BAR products have high data utilization in various fields such as agriculture, environment, land surface information, and atmosphere. In this study, BRDF-adjusted surface reflectance maps were calculated for the Korean peninsula from April 2011 to December 2012 with hourly temporal resolution from 9 a.m. to 4 p.m. For the BAR surface reflectance, the spatial observation range is from latitude 34° N to 39 °N and longitude 125 ° E to 130 ° E, and the spatial resolution is 500 m. The semi-empirical BRDF model was used to calculate the BRDF-adjusted surface reflectance, and the radiometric characteristics of surface reflectance were decomposed into isotropic scattering, geometric scattering, and volumetric scattering. For this model simulation, at least 7 clear pixels are required to fit BRDF model. In this study, unlike the Nadir BRDF-Adjusted surface Reflectance (NBAR) calculation method which was calculated from the existing polar orbiting satellites, semi-empirical BRDF modeling was performed with a value fixed to the satellite viewing angle for each pixel since geostationary satellites of GOCI are difficult to observe in the nadir direction unlike polar satellites. It is more effective to perform BRDF correction by fixing them at the viewing angle in the case of GOCI geostationary satellite.
 First
First Prev
Prev


Editorial Office of GEO DATA

#816, 8-13, Gwangpyeong-ro 56-gil, Gangnam-gu, 06367 Seoul, South Korea
Tel: +82-2-6677-5682 E-mail: geodata@gaidas.org
Corporate registration number: 780-82-00418