고정익 무인항공기를 이용한 그린란드 지형정보 데이터 구축
Establishment of Geographic Information Data of Greenland Glacier Using Fixed-wing Unmanned Aerial Vehicle
Article information

Trans Abstract
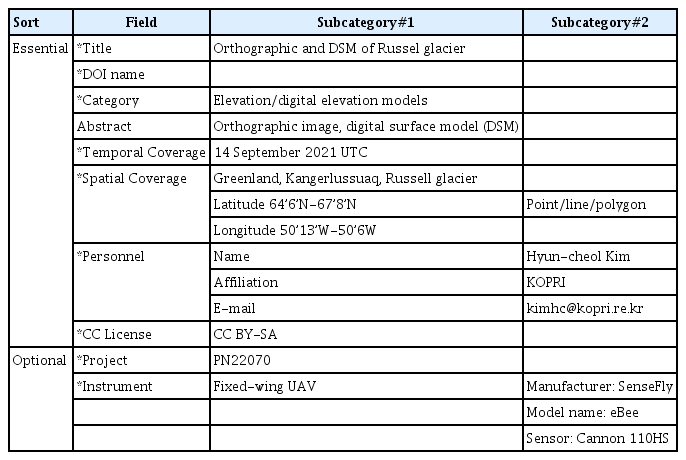
In recent decades, the Greenland glacier has experienced significant changes in the environment near the surface due to the increase in surface melting on glacier. In order to quantify these environmental changes, precise spatial information data is necessary. Although digital elevation models using satellite data are widely used to secure data, it is difficult to observe the polar regions by satellite alone due to limitations such as spatial resolution, revisit period, and weather. To overcome these shortcomings, many field geographic surveys using unmanned aerial vehicles are being conducted. In this study, a field survey was conducted on September 14, 2021 to produce high-resolution spatial information in the Russell glacier area located in the Greenland Kangerlussuaq. By matching the acquired aerial image data, orthorectification image with a spatial resolution of about 13 cm/pixel and a digital surface model are produced. This data is expected to be utilized as basic spatial data for Russell glacier runoff and topographical changes, and it is expected to be used as data that can grasp changes in time and spatial through continuous data accumulation.
1. 서론
최근 그린란드 빙상 표면 용융은 급격히 증가하였으며, 빙하의 흐름 속도 증가, 유출량 증가, 빙벽 붕괴 등 빙하 말단 근처의 환경 변화에 큰 영향을 미쳐왔다(Dirk Van, 2011; Rignot et al., 2010). 이러한 환경 변화를 정량적으로 파악하기 위해 정확하고 정밀한 시공간 변화 측정이 필요하다. 현재 전 지구적으로 수치표고모델이 구축되어 배포되고 있지만 낮은 공간해상도와 비정기적인 관측으로 인한 최신화가 지연되는 문제로 인하여 수치표고모델을 정밀 분석의 기초 자료로 활용하기에는 어려움이 있다. 우주항공기술의 발전과 함께 인공위성 원격탐사 센서 또한 상당히 발달하였으나 공간해상도의 한계, 재방문주기, 날씨 등의 한계점으로 인해 위성만으로 극지 표면을 정밀하게 관측하기엔 어려운 부분이 존재한다. 이러한 인공위성 활용의 단점을 보완할 수 있는 방안으로 초경량비행장치의 영상 획득과 고해상도 스테레오 영상정합 기술의 접목이 있다. 초경량비행장치를 활용하여 저고도에서 극지 표면 영상을 획득하고 영상정합을 통하여 고해상도 지리 정보 자료를 얻을 수 있다.
본 연구는 그린란드 캉가루수아크 러셀빙하 일대의 고해상도 공간정보 자료를 획득하였다. 이를 위해 고정익 무인항공기를 이용하여 2021년 9월 14일 현장조사를 수행하였다. 획득한 항공영상은 영상정합을 통해 정사영상과 수치표면모델을 제작하였다.
2. 본론
그린란드 캉가루수아크(Greenland, Kangerlussuaq)의 러셀빙하(Russell glacier) 지역은 빙하의 표면이 녹아서 운반되고 그 퇴적물이 하류에 침전되는 형태를 보인다. 러셀빙하 서쪽의 빙하퇴적물 호수는 주변지역에서 가장 크게 발달하여 호수의 역학에 대해 조사하기에 이상적으로 다양한 연구 현장조사가 이루어지고 있다(Fig. 1). 항공영상 촬영지역은 러셀빙하의 말단 부분에서 약 2,000 m 떨어진 지점으로 빙하와 식생이 경계를 이루는 지점이다(Fig. 2).

Location of the observation research site of Kangerlussuaq in Greenland.
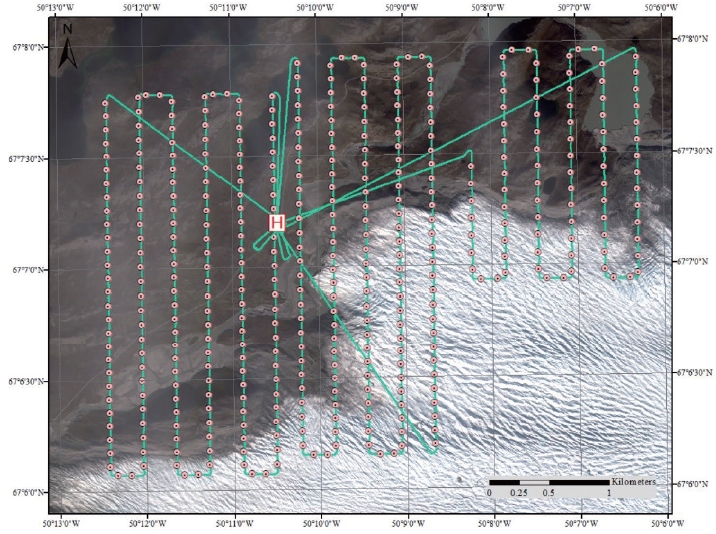
Camera locations and flight lines in the KOMPSAT-3 true color image (Setpember 6, 2021).
현장조사는 고정익 무인항공기인 SenseFly eBee를 이용하여 수행하였다(Table 1). 일반적으로 항공영상 촬영에 많이 활용되는 회전익 무인항공기와는 달리 고정익 무인항공기는 양력을 이용하여 비행하기 때문에 적은 에너지로 장시간 비행이 가능하다. eBee는 GPS/INS 센서 및 메모리에 사전 정의된 경로를 입력하여 자동비행이 가능하며, 비행시 자세정보, 위치정보 등을 실시간으로 기록한다. 또한 후처리 소프트웨어를 이용하여 비행 당시 기록한 IMU/INS 정보와 사전 수립한 경로정보를 바탕으로 정밀한 자세정보를 보정할 수 있다. 본 연구에서는 광역적인 지형 측정을 위해서 1,600만 화소의 캐논 미러리스 광학카메라를 eBee에 탑재하였다. 기체와 카메라의 자세한 사양은 Table 1과 같다.
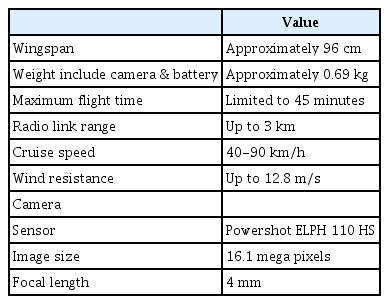
Specifications of fixed-wing UAV SenseFly eBee
비행경로는 빙하와 식생지역을 고르게 촬영하기 위하여 Fig. 2와 같이 계획을 수립하였으며, 영상정합을 위하여 인접영상 간 횡방향 70%, 종방향 80% 이상의 중첩도를 유지하도록 하였다. 비행고도는 해발고도 약 800 m로 SRTM (Shuttle Rada Topography Mission) 자료를 바탕으로 연구지역 내의 최고고도를 고려하여 선정하였다. 2021년 9월 14일 촬영 당시 지표 평균 기온은 영하 1-2도로 리튬배터리 사용에는 문제가 없으나 비행고도의 경우 급격히 기온이 낮아지기 때문에 기체 사양의 최대 비행시간보다 짧게 운영하였다. 기체의 안정적인 비행시간을 고려하여 연구지역 약 13 km2를 3번의 비행으로 구분하여 진행하였으며, 총 410장의 항공영상을 획득하였다(Fig. 2). 각 비행은 연속적으로 수행하여 유사한 태양 조건에서 진행되어 과한 노출이 생긴 영상은 발생하지 않았다(Fig. 3).
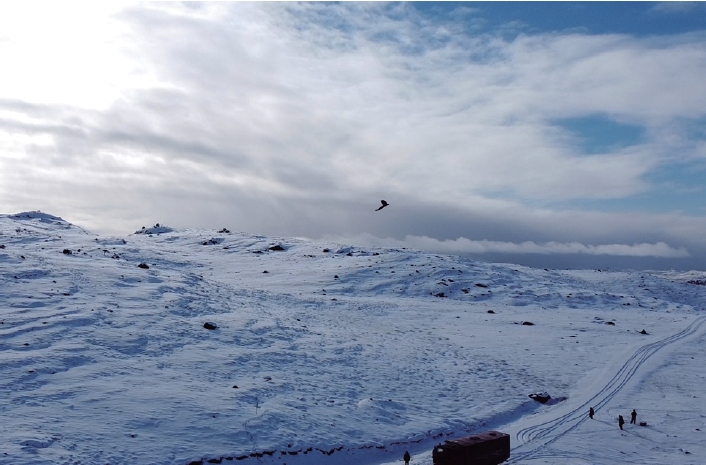
Fixed-wing unmanned aerial vehicle in flight.
본 연구에서 획득한 자료는 영상정합을 위하여 Pix4D Mapper 소프트웨어를 활용하였다. 소프트웨어는 작업의 흐름을 단계적으로 진행할 수 있으며, 각 단계마다 파라미터를 달리하여 재처리가 가능한 장점을 가지고 있다. 2차원 이미지에서 3차원 정보를 획득하기 위해서 이미지 정렬 방법 중의 하나인 structure from motion (SfM) 알고리즘을 사용하여 진행하였다. SfM은 여러 위치에서 촬영한 영상에서 3차원 위치정보 및 카메라 위치정보를 재구성할 수 있다(Ryan et al., 2015). 재구성한 3차원 정보를 가지는 점군 데이터는 빙하와 식생의 거친 표면을 표현하기 위하여 최대로 수행하였으며, 점군 데이터로부터 삼각망 기법으로 표면모델을 만들었다.
3. 결과
연구지역을 대상으로 고정익 무인항공기로 정사영상과 수치표면모델을 제작한 결과는 Fig. 4, Fig. 5와 같다. 정사영상은 지표 고도와 항공 촬영 동안 플랫폼의 기울어짐 등 기하학적인 왜곡을 보정한 영상지도를 말한다. 제작한 정사영상과 수치표고모델의 자료 처리시 영상 간 절대 위치정확도는 전체적으로 미터 이하의 정확도를 나타내고 있다(Table 2). Fig. 4의 정사영상에서는 우측 아래의 빙하 표면의 상태가 잘 나타나고 있으나, 식생이 분포하고 있는 좌측 상단 부분을 포함한 전체적인 지역이 적설로 인하여 백색을 띄고 있다. 하지만 빙하와는 달리 붉은색으로 나타나는 부분이 식생이 분포하고 있는 지역으로 하천을 경계로 빙하가 없는 지역에 식생 분포를 확인할 수 있다. 또한 빙하가 부서져서 유출되는 부분의 경계를 관측할 수 있으며, 빙하 표면의 고도 변화는 Fig. 5의 수치표면모델로 확인 가능하다. 빙하의 표면의 거친 상태나 빙하지대 앞에 생긴 하천의 형태 등 또한 관측할 수 있다. 고정익 무인항공기를 이용한 수치표면모델을 Polar Geospatial Center (PGC)에서 배포하는 ArcticDEM과 비교하였다. ArcticDEM은 다양한 광학 스테레오 영상 및 고도계 등 다중센서를 활용하여 제작한 자료이다(Porter et al., 2018). 현재 배포되는 자료는 2018년에 배포한 자료로 그에 활용한 영상은 그 이전 영상으로 추정할 수 있다. ArcticDEM과 2021년에 획득한 무인항공기 추정 digital surface model의 고도 차이는 Fig. 6과 나타났으며, 식생이 분포하는 지역에서는 전체적으로 약 4년간 유사한 고도를 유지하였다. 하지만 빙하가 위치하고 있는 지역은 대부분 30미터 이상 감소한 것으로 나타났으며, 빙하 끝단에서는 더 크게 감소한 것을 확인하였다. 추후 무인항공기를 활용한 수치표면모델의 지속적인 자료 축적을 통하여 빙하의 상태 변화를 시계열로 관측하는 자료로 활용할 것이다(Geissler et al., 2021; Groos et al., 2019; Turner et al., 2015; Winsvold et al., 2016).
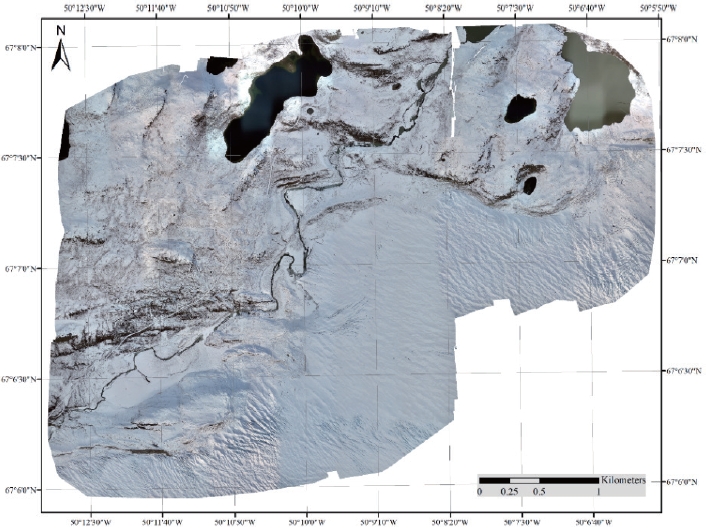
Orthomosaic image as a result of topographic survey.
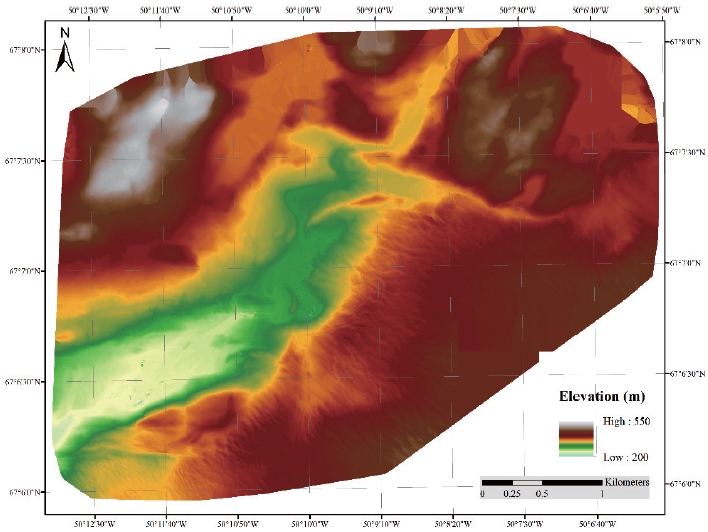
Digital surface model as a result of topographic survey.

Absolute geolocation variance result
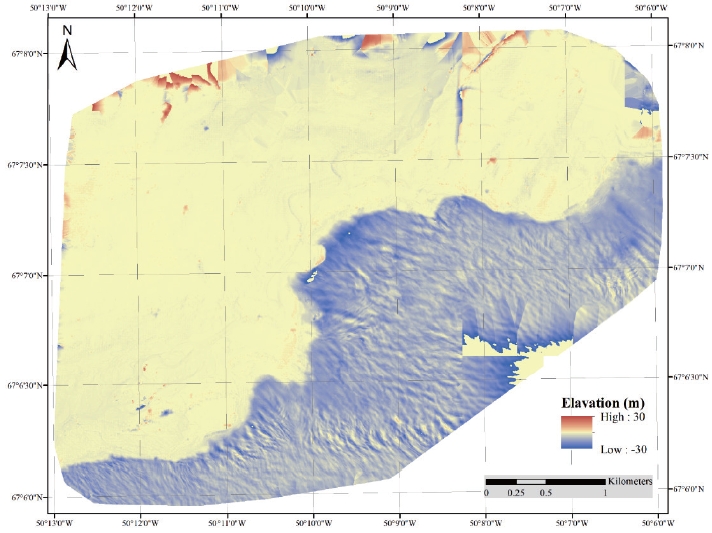
Diffence between ArcticDEM and unmanned aerial vehicle’s digital surface model.
4. 결론 및 토의
그린란드 캉가루수아크 러셀빙하 일대는 그린란드 빙상이 유출되는 경계지역으로 환경 변화와 빙하역학에 대한 연구가 많이 이루어지는 지역이다. 본 연구에서는 러셀빙하 주변의 식생과 빙하를 관측할 수 있는 지역을 대상으로 고정익 무인항공기를 이용한 공간정보 자료를 구축하였다. 무인기로 촬영한 항공영상은 영상정합을 통하여 약 13 cm/pixel 공간 해상도의 정사영상과 수치표면모델을 제작할 수 있었다. 이러한 연구 결과는 지속적인 자료의 축적으로 빙하의 상태 변화를 파악할 수 있다. 또한 한번 제작하면 지속적인 최신화가 어렵고 몇 년 주기로 제작하는 기존의 수치표면모델을 대신하는 고해상도 최신 자료로 활용 가능하다. 향후 지속적인 현장관측과 다중분광 자료 획득을 통한 식생분석을 통하여 다중시기에 대한 러셀빙하 일대의 환경 변화를 파악할 수 있을 것으로 기대한다.
Notes
Conflict of Interest
Hyun-Cheol Kim has been an Editorial Board of GEO DATA; however, he was not involved in the peer reviewer selection, evaluation, or decision process of this paper. Otherwise, no other potential conflicts of interest relevant to this paper were reported.
Funding Information
This research was supported by ‘the International Research & Development Program of the National Research Foundation of Korea (NRF) funded by the Ministry of Science and ICT (PN22070)’ and ‘Korea Polar Research Institute (PE23040)’.