
Articles
- Page Path
- HOME > GEO DATA > Volume 6(1); 2024 > Article
-
Original Paper
지상 영상레이더 위상간섭기법 기반 댐 사면 안정성 평가 -
박성천1,†
 , 홍상훈2,*,†
 - Evaluation of Slope Stability on Dam Using Ground-based Interferometric Radar
-
Seongcheon Park1,†, Sanghoon Hong2,*,†
-
GEO DATA 2024;6(1):24-31.
DOI: https://doi.org/10.22761/GD.2024.0001
Published online: March 21, 2024
1Master Student, Department of Geological Sciences, Pusan National University, 2 Busandaehak-ro 63beon-gil, Geumjeong-gu, 46241 Busan, South Korea
2Associate Professor, Department of Geological Sciences, Pusan National University, 2 Busandaehak-ro 63beon-gil, Geumjeong-gu, 46241 Busan, South Korea
- Corresponding Author Sanghoon Hong Tel: +82-51-510-3753 E-mail: geoshong@pusan.ac.kr
- †These authors contributed equally to this work.
Copyright © 2024 GeoAI Data Society
This is an Open Access article distributed under the terms of the Creative Commons Attribution Non-Commercial License (http://creativecommons.org/licenses/by-nc/3.0/) which permits unrestricted non-commercial use, distribution, and reproduction in any medium, provided the original work is properly cited.
- 420 Views
- 14 Download
Abstract
- Dams are man-made structures built to manage water resources efficiently and prepare for natural disasters such as droughts and floods. It requires careful and continuous inspection to prevent its failure. Research reported to assess dam stability using terrestrial surveys such as ground penetration radar, electrical resistivity tomography, and remote sensing methods such as space-borne synthetic aperture radar (SAR). Differential interferometric SAR (DInSAR) calculates the phase difference between two consecutive images acquired at separate times and has been widely utilized to detect surface displacement from volcanoes, earthquakes, and ground subsidence. However, space-borne InSAR applications have limitations in acquiring flexible data for specific dates or regions due to the revisit cycle of the orbital configuration and the fixed acquisition geometry. In this feasibility study, the slope stability of the dam was evaluated using the Gamma Portable Radar Interferometer-II (GPRI-II) which has the advantage of overcoming the limitation of satellite observations. The GPRI-II is a ground-based real aperture radar that operates in the Ku-band wavelength (~1.7 cm), providing convenient portability and installation for high spatial and temporal resolution. A total of 20 GPRI-II datasets were acquired for 22 minutes on June 7, 2023, at a dam in Jeollanam-do for the DInSAR application. The displacement calculation revealed an average displacement of approximately -0.36 mm at a randomly selected point, which is negligible. The average displacement of -0.17 mm was observed for the entire dam. Our results suggest that ground-based radar interferometry could assess the dam slope stability.
- 댐은 수자원 관리와 수재해 대비를 위해 건설된 인공구조물의 한 종류로서 효과적인 활용과 안전관리를 위한 지속적인 모니터링이 요구된다. 이와 같은 인공구조물 안정성 평가 자료 구축을 위해 탄성파 탐사, 전기 비저항 탐사, 위성 항법 시스템(Global Navigation Satellite System) 등 다양한 현장조사가 진행되고 있다(Adamo et al., 2021). 하지만 현장조사의 경우 공간적, 경제적 측면에 있어 자료 획득이 제한적이므로 보다 광범위한 지역에 대한 주기적인 관측 자료의 구축을 위해 인공위성 영상레이더(synthetic aperture radar, SAR) 기반 위상간섭기법(interferometric SAR, InSAR)이 널리 사용되고 있다(Milillo et al., 2016). 차분위상간섭기법(differential SAR interferometry, DInSAR)은 서로 다른 시기에 관측된 두 영상 사이의 위상차를 계산하는 것으로서 수 cm-수 mm의 미세 지표 변위 관측이 가능하다(Rosen et al., 2000). 하지만 인공위성 영상레이더 자료는 일정한 주기로 특정 궤도를 따라 경사 거리 방향으로 영상을 획득하기 때문에 관측 범위를 벗어나거나 관심 지역이 산악지형 등에 가려져 있는 경우 자료 획득이 어려울 수 있다. 지상 영상레이더는 장비의 이동과 설치가 편리하여 관심 지역에 대한 고해상도의 자료를 원하는 시기에 획득할 수 있다. 또한, 차분위상간섭기법 적용 시 산사태 등과 같이 단기간에 발생하는 지표 변위 현상을 관측하는 데 용이하며 사면침식, 빙하 등 다양한 환경에 대한 국내외 연구가 활발히 진행되고 있다(della Campania, 2014; Jeong et al., 2023).
- Gamma Portable Radar Interferometer-II (GPRI-II)는 Gamma remote sensing에서 개발한 Ku-band (1.73-1.75 cm) 파장대역을 사용하는 지상 기반 real aperture radar로 시공간적으로 고해상도의 자료를 획득할 수 있다(Werner et al., 2008b). 각각 3개의 수직(vertical), 수평(horizontal)안테나로 구성된 총 6개의 2 m 길이 안테나를 사용하며, 단일 및 다중 편파 관측 모드를 제공한다. 단일 편파 모드의 경우 세 개의 안테나를 사용하며, 한 개의 송신안테나(TX1)와 두 개의 수신안테나(RX1, RX2)를 통해 VV 또는 HH의 단일 편파 자료를 획득한다. 다중 편파 모드의 경우 6개의 안테나를 모두 사용하며, 두 개의 송신안테나(TXA, TXB)와 네 개의 수신안테나(RX1A, RX1B, RX2A, RX2B)를 통해 VV, HH, VH, HV의 다중 편파 자료를 획득한다. 삼각대에 고정된 타워가 회전하면서 안테나로 수신된 신호를 획득하며, 적합한 관측 기하 설정을 위해 회전각도, 회전속도, 안테나의 관측각도 등 여러 가지 시스템 관측 변수의 변경이 가능하다(Werner et al., 2008a). 또한 대상 지역의 토지 피복 형태 및 지형, 구조물에 대한 산란 특성이 다르므로 신호 감쇄(attenuation) 상수 조정을 통해 최적의 자료 획득이 가능하다. 뿐만 아니라 GPRI-II는 지표 변위 관측 모드와 수치표고모형 제작 모드가 제공되므로 연구 목적에 맞는 적절한 자료 관측 환경 설정이 필요하다(Werner et al., 2012). GPRI-II는 매우 짧은 시간 간격으로 자료를 획득할 수 있으므로 차분위상간섭기법을 적용하는 경우, 대상 지역 특성에 대한 decorrelation 시간 평가나 미세 지표 변위 관측이 가능하다(Riesen et al., 2011). 본 연구는 지상 영상레이더를 통한 댐 사면 모니터링 자료 구축 가능성 평가를 위해 전라남도에 위치한 A댐 사면에 대한 GPRI-II 자료를 획득하였고, 정밀한 변위 정보를 획득하기 위해 차분위상간섭기법을 통한 구조물 변위 모니터링 자료를 제작하였다.
1. 서론
- 2.1 연구 지역
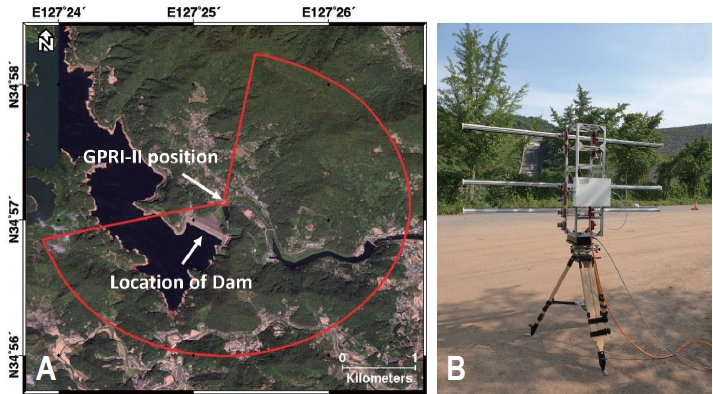
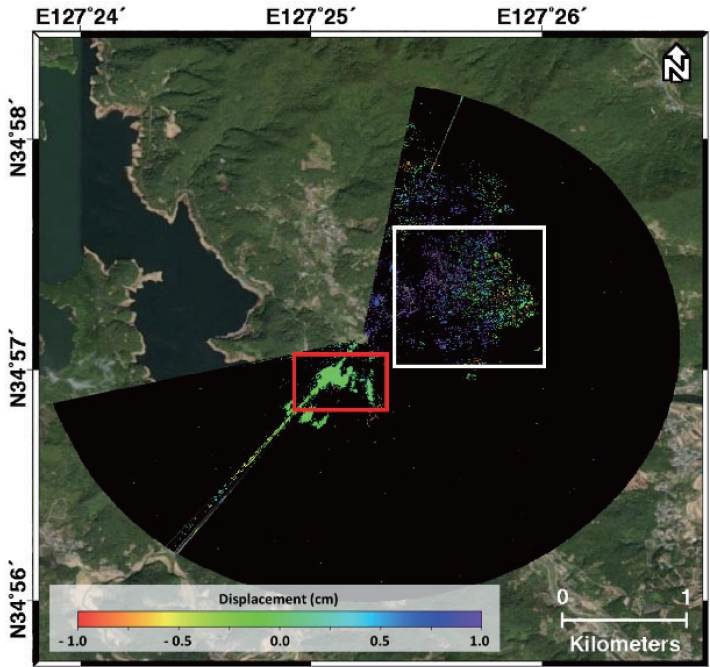
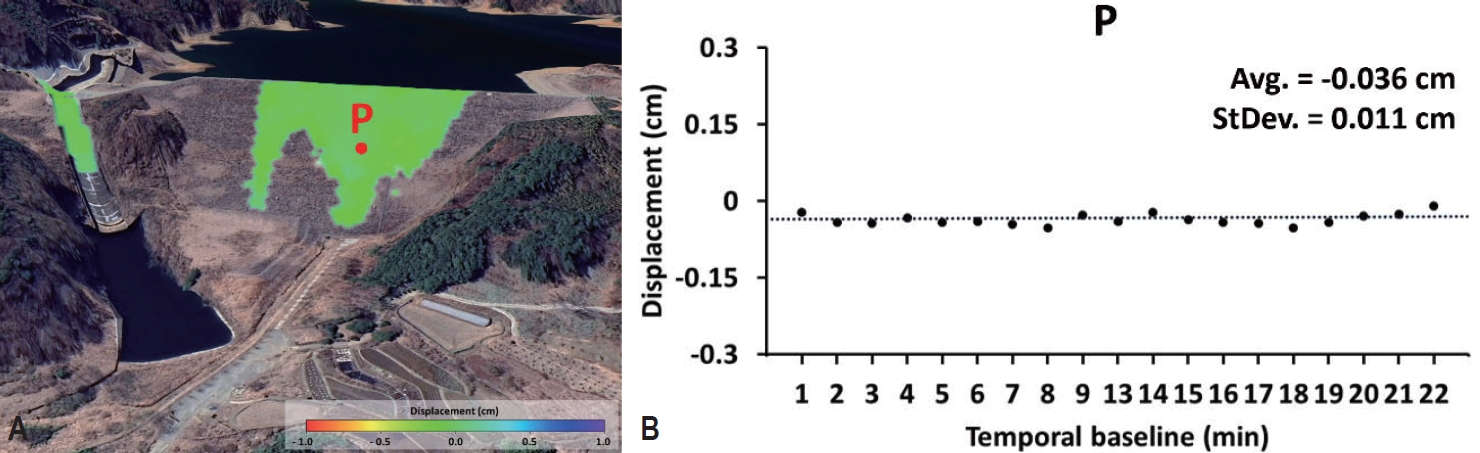
- 본 연구는 지상 영상레이더 자료를 통한 댐 사면 모니터링 자료 구축 가능성 평가를 위해 전라남도에 위치한 A댐을 연구 지역으로 설정하였다. A댐은 인근 댐의 조정지 역할 및 수자원 관리를 위해 건설되었으며, 주변 대규모 산업단지에 공업 용수를 안정적으로 공급하고 있다. Fig. 1A는 연구 지역과 획득한 GPRI-II 자료 영역 및 장비 설치 위치를 나타낸 그림이다. Fig. 1B는 자료 획득 당시의 설치 사진으로 댐의 사면과 수문이 GPRI-II 관측 영역 내에 존재함을 확인할 수 있으며, 댐 구조물 이외에도 식생 및 철제 울타리 등 기타 장애물이 위치하고 있다.
- 2.2 연구 자료
- 댐 구조물 변위 모니터링 가능성 평가를 위해 GPRI-II 장비를 이용하여 지상 영상레이더 자료를 획득하였다. 2023년 6월 7일 16시 17분 42초부터 22분 동안 관측을 실시하여 총 20장의 GPRI-II 원시 자료를 구축하였으며, GPRI-II 자료 특성은 Table 1과 같다. 세 개의 안테나를 통해 관측하였으며, 두 개의 수신안테나 중 RX2 안테나를 통해 VV 단일 편파 자료를 획득하였다. Azimuth 방향으로의 자료 획득 영역을 결정하는 회전각도는 타워의 중앙(0°)을 기준으로 -150°(좌측) to 100°(우측)로 설정하여 총 250° 회전하여 연구 지역을 관측하였으며, 회전 속도는 10 deg/s로 설정하였다. 또한, 수신(receiver) 및 송신(transmitter) 안테나에 대한 감쇄 상수(attenuation)를 각각 22 dB과 2 dB로 적용하여 자료를 획득하였다.
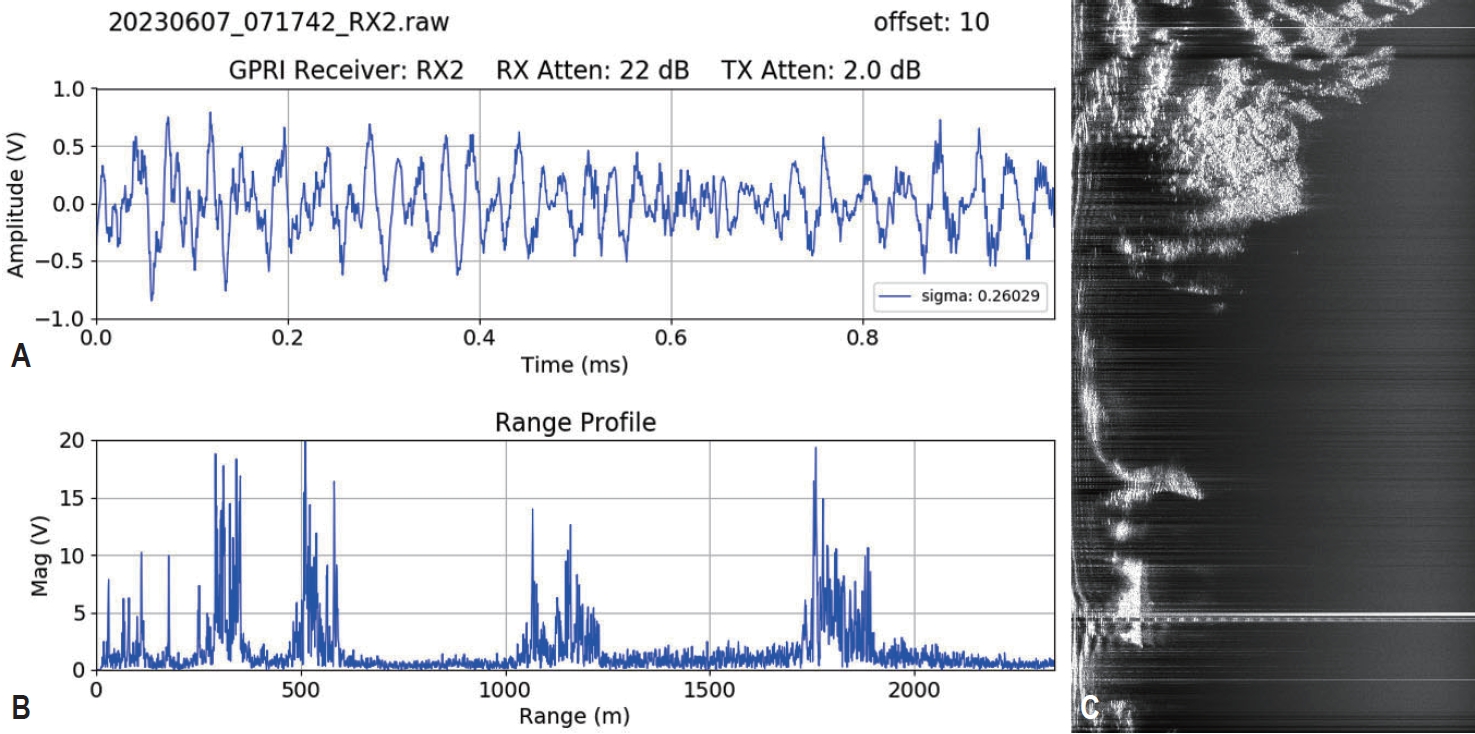
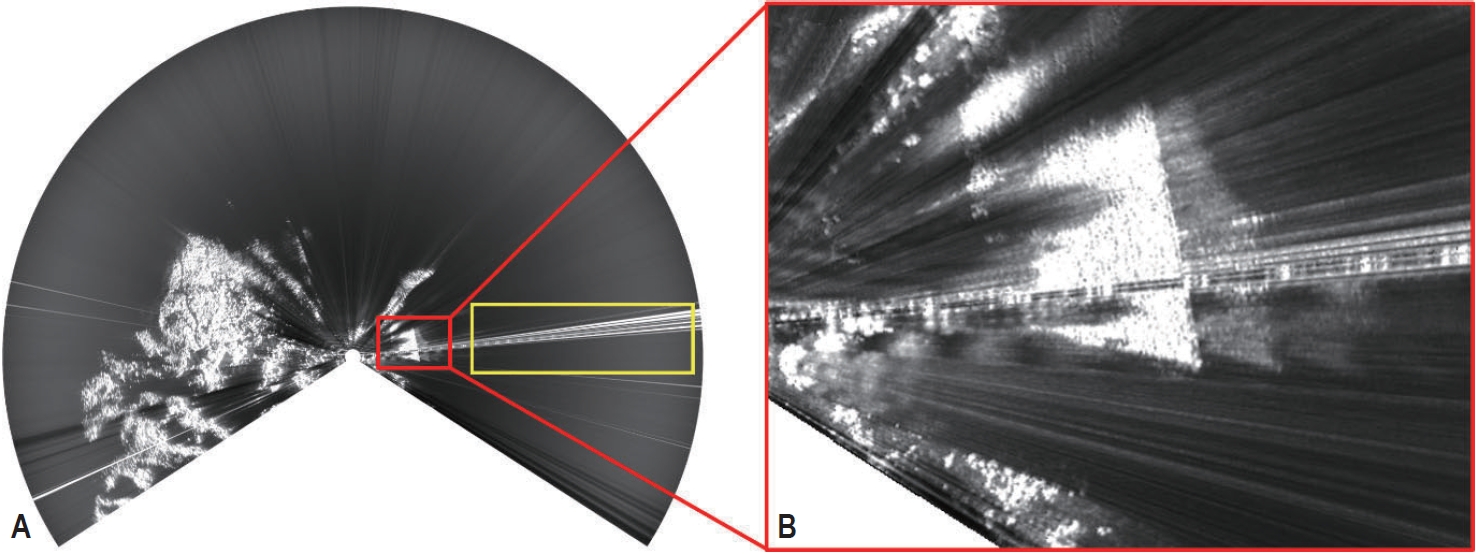
- Fig. 2A, B는 2023년 6월 7일 16시 17분 42초에 획득된 GPRI-II 원시 자료 프로파일로 시간 및 거리에 대한 신호의 세기를 나타내며 초기 자료의 특성을 보여준다. 거리에 대해 range 방향으로 압축된 신호를 도시한 그래프인 Fig. 2B 상에서 강한 산란체에 의한 신호 포화(saturation) 현상이 부분적으로 발생하였음을 확인할 수 있다. Fig. 2C는 해당 원시 자료로 제작한 multi-looked intensity (MLI) 영상이다.
2. 연구 지역 및 자료
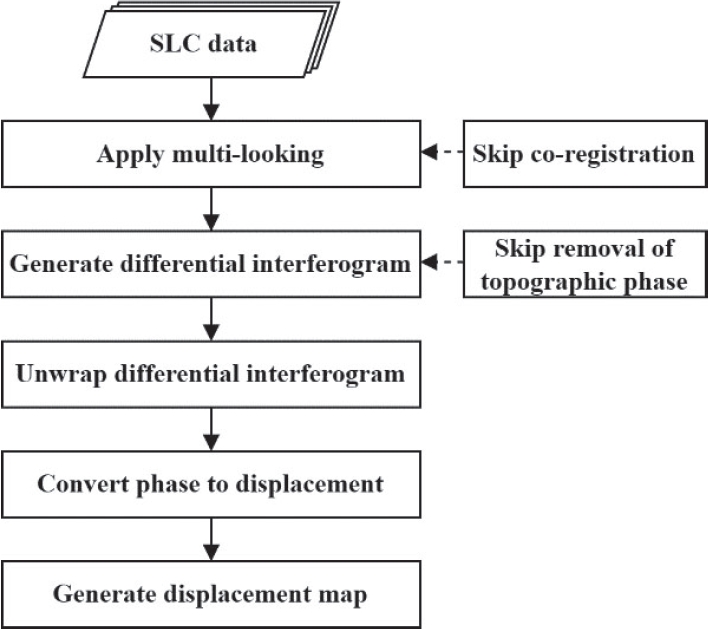
- 본 연구는 상용 소프트웨어 GAMMA를 사용하여 GPRI-II 지상 영상레이더 자료 전처리 및 차분위상간섭기법을 적용하였다. 총 20장의 원시 자료를 single look complex 영상으로 자료 처리를 실시한 후 2×10 비율의 멀티룩 계수를 적용하여 MLI 영상을 제작하였다. 동일한 위치에서 하나의 수신 안테나를 통해 연속적으로 획득한 자료를 사용하였기 때문에 일반적인 위상간섭기법에 적용되는 두 영상을 동일한 화소에 위치시키는 정합 과정과 기선 거리에 따른 지형에 의한 위상 제거 과정은 필요하지 않았다(Werner et al., 2009). 최초로 획득된 자료를 주영상으로 선정하여 나머지 19장의 영상들에 대해 차분위상간섭기법을 적용하여 총 19장의 차분위상간섭도와 긴밀도 영상을 제작하였다. 이후 minimum cost flow 알고리즘을 통해 위상 언래핑 과정을 수행하였으며, 간섭도 내의 절대 위상을 line-of-sight (LOS) 방향 변위로 변환하여 총 19장의 변위지도를 제작하였다(Fig. 3). 제작한 변위지도 상에서 댐 사면과 수문을 제외한 영역은 0.7의 긴밀도 임계치를 적용하여 마스킹 처리하였으며, 지오코딩 후 최종 변위지도를 제작하였다.
3. 자료 처리
- 4.1 MLI 영상 분석 결과
- Fig. 4는 20장의 MLI 평균 영상으로 연구 지역에 대해 고해상도 자료 획득이 가능하며, 시스템 관측 변수 설정에 따라 획득된 자료의 특성을 보여준다. Fig. 4A의 노란색 부분은 강한 산란체에 의해 신호가 포화된 현상을 보여주며 해당 위치에 존재하는 댐 내부로 들어가는 철문에 의해 영상 내에서 직선 상의 강한 신호 잡음이 남아있음을 확인할 수 있다. Fig. 4B는 댐 사면을 확대한 사진으로 사면 뒤로 고스트 현상이 관측된다. 이는 지상 레이더로부터 가까운 거리에 산란체가 존재할 경우 발생할 수 있는 현상으로 자료 획득 시 적절한 감쇄 상수 설정이 요구됨을 지시한다(Guarnieri, 2005).
- 4.2 긴밀도 및 차분위상간섭도 분석 결과
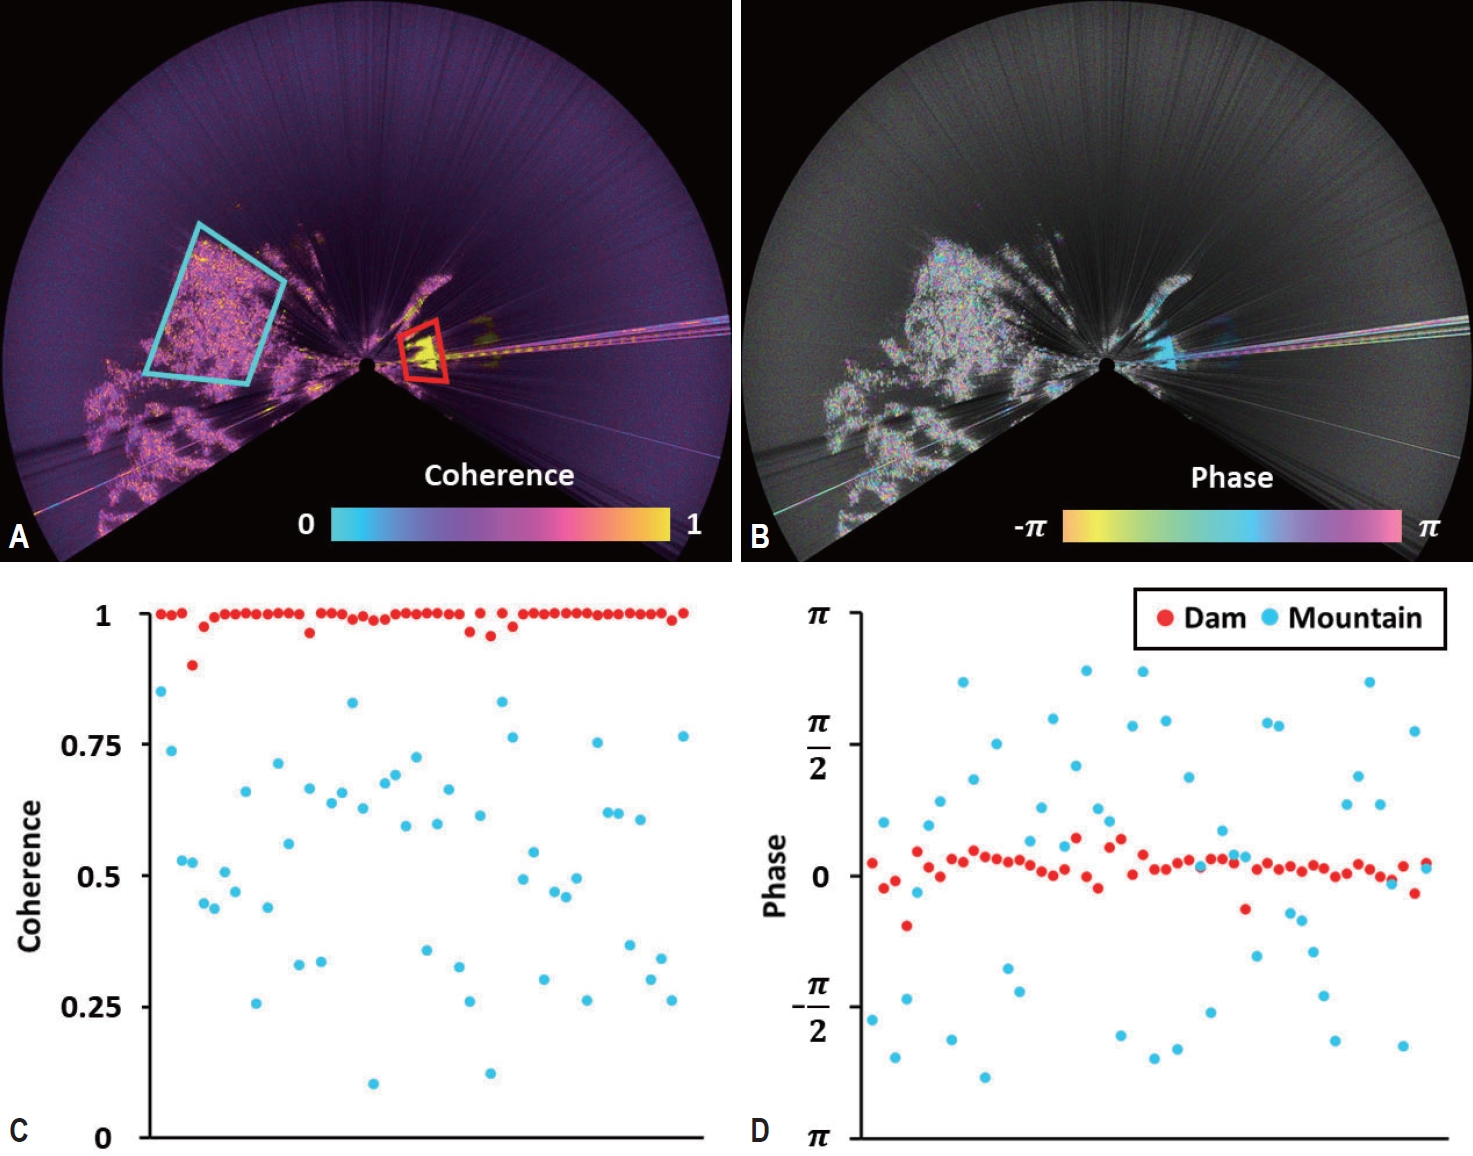
- Fig. 5A, B는 제작한 간섭도 중 시간 간격이 가장 긴 차분위상간섭도와 긴밀도 영상이며, 댐 사면(붉은색)과 식생지역(하늘색)에 대한 분석을 수행하였다. Fig. 5C는 댐 사면과 식생지역에서 각각 임의로 추출한 50개의 점에 대한 긴밀도 값을 도시한 결과로 사면에서는 평균 약 0.95의 높은 긴밀도 값이 유지되었으며, 식생지역에서는 평균 약 0.41의 비교적 낮은 긴밀도 값이 나타났다. Fig. 5D는 동일한 위치에서 차분위상간섭도 상의 위상분포를 보여주는 결과로, 긴밀도가 높은 댐 사면에서는 비교적 일정한 위상분포가 관측되었으며, 낮은 긴밀도의 식생지역에서는 위상분포가 불규칙적인 패턴을 보였다. 짧은 시간 간격임에도 식생 투과율이 낮은 Ku-band 특성상 식생에 의해 무작위적 위상분포와 긴밀도 저하가 발생한 것으로 해석된다(Hong & Wdowinski, 2013). 또한, 두 영상 모두 실제 지형이나 구조물이 아닌 포화(saturation) 현상에 의해 남아있는 부분에서도 신호가 관측됨을 확인할 수 있다.
- 4.3 지오코딩 및 변위 자료 분석 결과
- Fig. 6은 Fig. 5B의 차분위상간섭도에 위상 언래핑 과정을 수행한 후 LOS 방향 변위로 변환하여 지오코딩을 수행한 변위 결과이다. 변위 결과 상에서 댐 사면과 수문이 위치한 붉은색 부분은 안정적인 변위를 보이며, 해당 구조물에서 큰 변위 신호는 관측되지 않았다. 하얀색 부분은 낮은 긴밀도의 식생지역으로 간섭도 상의 복잡한 위상패턴이 변위로 변환됨에 따라 일관되지 않은 패턴의 변위 신호가 관측되었다.
- Fig. 7A는 Fig. 6의 결과에서 댐 사면과 수문 이외에 기타 지역을 마스킹하여 구글어스 상에 도시한 그림으로 LOS 방향으로 멀어질수록 음의 값을, 가까워질수록 양의 값을 나타내며 사면 일부 영역은 자료 획득 당시 주변 식생 및 장애물에 의해 신호가 획득되지 않았음을 확인할 수 있다. 전체 영역에 대한 변위 분석 결과, -0.17 mm의 평균 변위가 관측되었으며, 안정적인 변위 신호를 확인하였다. Fig. 7B는 임의의 한 점 P를 선정하여 제작한 19장의 변위지도에서의 값을 도시한 결과이다. 점 P에서 약 -0.36 mm의 평균 변위와 0.11 mm의 표준편차가 관측되었으며 큰 변위 신호는 관측되지 않았다. 본 연구 결과는 GPRI-II 지상 영상레이더를 통해 고해상도의 데이터셋 구축 및 위상간섭기법을 적용하여 효과적인 구조물 모니터링 자료 제작이 가능함을 보여준다.
4. 연구 결과
- 본 연구는 GPRI-II 지상 영상레이더로 획득된 자료의 특성을 보여주며, 댐 사면 안정성 평가를 위한 자료 관측 가능성을 제안하였다. 실험용 지표 변위지도 제작을 위해 연구 지역에 대한 지상 영상레이더 자료를 획득하였으며, 차분위상간섭기법을 통해 총 19장의 지표 변위 자료를 계산하였다. 제작된 변위 자료를 통해 댐 사면 안정성에 대한 지표 변위 관측이 효과적임을 확인하였으며, 주기적인 상시 관측을 통해 시계열 지표 변위 분석이 가능할 것으로 판단된다. 하지만 GPRI-II 지상 영상레이더는 감쇄 상수, 회전속도, 회전각도 등 다양한 시스템 환경 변수 설정에 따라 관측 자료의 품질이 달라지므로 보다 좋은 자료 구축을 위해서는 연구 지역의 산란 특성에 대한 고려가 요구된다. 본 연구에서 차분위상간섭기법을 통해 관측한 지표 변위는 매우 미세하며 이는 대기 성분 혹은 기타 시스템 단계에서의 잡음으로 해석된다. 이를 위해 추가적인 자료 획득 과정이 요구되며, 시계열 위상간섭기법 분석을 통해 보다 정밀한 변위 관측이 가능할 것으로 기대된다. 본 연구 결과는 지상 영상레이더 장비를 활용한 고해상도 자료 구축 및 변위 자료 제작이 가능함을 보여주었으며, 위상간섭기법을 통한 댐 사면 안정성 평가 자료로의 활용 가능성을 시사한다.
5. 토의 및 결론
-
Conflict of Interest
On behalf of all authors, the corresponding author states that there is no conflict of interest.
-
Funding Information
This work was supported in part by the National Research Foundation of Korea (NRF) grant funded by the Korean Government (MSIT) under Grant NRF-2023R1A2C1003609.
-
Data Availability Statement
The data that support the findings of this study are available on request from the corresponding author. The data are not publicly available due to privacy or ethical restrictions.
Notes

- Adamo N, Al-Ansari N, Sissakian V, et al (2021) Geophysical methods and their applications in dam safety monitoring. J Earth Sci Geotech Eng 11(1):291–345Article
- della Campania C (2014) Comparison between differential SAR interferometry and ground measurements data in the displacement monitoring of the earth-dam of Conza della Campania (Italy). Remote Sens Environ 148:58–69Article
- Guarnieri AM (2005) Adaptive removal of azimuth ambiguities in SAR images. IEEE Trans Geosci Remote Sens 43(3):625–633Article
- Hong SH, Wdowinski S (2013) Interferometric coherence analysis using space-borne synthetic aperture radar with respect to spatial resolution. Korean J Remote Sens 29(4):389–397Article
- Jeong HJ, Hong SH, Lee JY, et al (2023) Evaluation of Ku-band ground-based interferometric radar using gamma portable radar interferometer. Korean J Remote Sens 39(1):65–76
- Milillo P, Perissin D, Salzer JT, et al (2016) Monitoring dam structural health from space: insights from novel InSAR techniques and multi-parametric modeling applied to the Pertusillo dam Basilicata, Italy. Int J Appl Earth Obs Geoinf 52:221–229Article
- Riesen P, Strozzi T, Bauder A, et al (2011) Short-term surface ice motion variations measured with a ground-based portable real aperture radar interferometer. J Glaciol 57(201):53–60Article
- Rosen PA, Hensley S, Joughin IR, et al (2000) Synthetic aperture radar interferometry. Proc IEEE 88(3):333–382Article
- Werner C, Strozzi T, Wiesmann A, Wegmüller U (2008a) A real-aperture radar for ground-based differential interferometry. In: IGARSS 2008-2008 IEEE International Geoscience and Remote Sensing Symposium, Boston, 7-11 Jul 2008
- Werner C, Strozzi T, Wiesmann A, Wegmüller U (2008b) GAMMA’s portable radar interferometer. In: 13th FIG International Symposium on Deformation Measurements and Analysis, Lisbon, 12-15 May 2008
- Werner C, Strozzi T, Wiesmann A, Wegmüller U (2009) A ground-based real-aperture radar instrument for differential interferometry. In: 2009 IEEE Radar Conference, Pasadena, 4-8 May 2009
- Werner C, Wiesmann A, Strozzi T, et al (2012) The GPRI multimode differential interferometric radar for ground-based observations. In: EUSAR 2012; 9th European Conference on Synthetic Aperture Radar, Nuremberg, 23-26 Apr 2012
References
Appendix
| Sort | Field | Subcategory#1 | Subcategory#2 |
|---|---|---|---|
| Essential | *Title | GPRI-II data and displacement map of the Dam | |
| *DOI | https://doi.org/10.22711/idr/1012 | ||
| *Category | Geoscientific Information | ||
| Abstract | In this study, we acquired 20 of GPRI-II raw data and created 19 of displacement map for evaluating slope stability and constructing displacement map datasets of Dam using GPRI-II with ground-based interferometric radar | ||
| *Temporal Coverage | 1 day | 2023.06.07. | |
| *Spatial Coverage | Suncheon-si, Jeollanam-do | South Korea | |
| WGS84 Coordinates | Polygon | ||
| *Personnel | Name | Sang Hoon Hong | |
| Affiliation | Pusan National University | ||
| geoshong@pusan.ac.kr | |||
| *CC License | CC BY-NC | ||
| Optional | *Project | ||
| *Instrument | GPRI-II |
Figure & Data
References
Citations
 PubReader
 ePub Link
 Cite
Cite


#816, 8-13, Gwangpyeong-ro 56-gil, Gangnam-gu, 06367 Seoul, South Korea
Tel: +82-2-6677-5682 E-mail: geodata@gaidas.org
Corporate registration number: 780-82-00418
