
Articles
- Page Path
- HOME > GEO DATA > Volume 3(4); 2021 > Article
-
Article
Space Science
GOCI 정지궤도위성을 이용한 한반도 BRDF-Adjusted Surface Reflectance 지도 데이터 - 염종민*
- The Map Data of BRDF-Adjusted Surface Reflectance from GOCI Geostationary Satellite Imagery over Korean Peninsula
- Jong-Min Yeom*
-
GEO DATA 2021;3(4):66-70.
DOI: https://doi.org/10.22761/DJ2021.3.4.006
Published online: December 31, 2021
한국항공우주연구원 위성활용부, 대전 34133, 대한민국
Satellite Application Division, Korea Aerospace Research Institute, Daejeon 34133, Republic of Korea
- *Corresponding author: yeomjm@kari.re.kr
• Received: December 15, 2021 • Revised: December 24, 2021 • Accepted: December 27, 2021
Copyright © 2021 GeoAI Data Society
This is an Open Access article distributed under the terms of the Creative Commons Attribution Non-Commercial License (http://creativecommons.org/licenses/by-nc/3.0/) which permits unrestricted non-commercial use, distribution, and reproduction in any medium, provided the original work is properly cited.
- 240 Views
- 7 Download
요약문
- 본 연구는 천리안 정지궤도위성(COMS: Communication, Ocean and Meteorological Satellite)에 탑재되어 있는 해색센서(GOCI: Geostationary Ocean Color Imager)를 이용하여 한반도 BRDF (Bidirectional Reflectance Distribution Function) 보정 지표반사도(SR: Surface Reflectance) 공간지도를 산출하였다. BRDF 보정된 지표반사도(BAR)는 주간동안 태양광 고도에 따른 지표반사도 변화특성을 보정하였기 때문에, 식생의 생육 특성을 정량적으로 파악할 수 있을 뿐만 아니라 시계열 관측특성에서 발생하는 방향성 오차가 보정된 고유의 지표변화특성 값을 산출할 수 있다. 따라서 본 산출 자료는 농업, 환경, 지면정보, 및 대기 등 다양한 분야에서 자료 활용도가 높다. 본 연구에서는 2011년 4월부터 2012년 12월까지 우리나라 한반도 지역에 대한 BRDF 보정 지표반사도 지도를 산출하였다. BAR 지표반사도의 경우, 공간적인 관측 범위는 위도 34° N to 39 °N 와 경도 125 °E to 130 °E 범위이며, 공간해상도는 500 m이다. 본 연구에서는 BRDF 보정 지표반사도 산출을 위해서 Semi-empirical BRDF model 모델을 이용하여 지표반사도 특성을 Isotropic scattering, Geometric scattering, 그리고 Volumetric scattering으로 분해하였다. 이를 위해 최소 7개의 청천 화소가 필요하다. 본 연구에서는 기존의 극궤도위성에서 산출한 NBAR (Nadir BRDF-Adjusted surface Reflectance) 지표반사도 산출 방법과 다르게, 각 화소에 대해서 위성보기각에 고정시킨 값으로 BRDF 모델링을 수행했다. 이는 정지궤도위성은 극궤도위성과 달리 직하방향에 대한 관측이 어렵기 때문에 보기각에 고정시켜서 BRDF 보정을 수행하는 것이 더 효과적이다.
Abstract
- In this study, the spatial maps of the BRDF (Bidirectional Reflectance Distribution Function) adjusted surface reflectance (SR) were estimated by using the Geostationary Ocean Color Imager (GOCI) mounted on the Communication, Ocean and Meteorological Satellite (COMS) over the Korean Peninsula. The BRDF-Adjusted surface Reflectance (BAR) is a more effective indicator that not only quantitatively identifies the growth characteristics of vegetation, but also corrects the bidirectional error in the time series observation characteristics, because the surface reflectance is changed according to the solar altitude during the daytime period. Therefore, this BAR products have high data utilization in various fields such as agriculture, environment, land surface information, and atmosphere. In this study, BRDF-adjusted surface reflectance maps were calculated for the Korean peninsula from April 2011 to December 2012 with hourly temporal resolution from 9 a.m. to 4 p.m. For the BAR surface reflectance, the spatial observation range is from latitude 34° N to 39 °N and longitude 125 ° E to 130 ° E, and the spatial resolution is 500 m. The semi-empirical BRDF model was used to calculate the BRDF-adjusted surface reflectance, and the radiometric characteristics of surface reflectance were decomposed into isotropic scattering, geometric scattering, and volumetric scattering. For this model simulation, at least 7 clear pixels are required to fit BRDF model. In this study, unlike the Nadir BRDF-Adjusted surface Reflectance (NBAR) calculation method which was calculated from the existing polar orbiting satellites, semi-empirical BRDF modeling was performed with a value fixed to the satellite viewing angle for each pixel since geostationary satellites of GOCI are difficult to observe in the nadir direction unlike polar satellites. It is more effective to perform BRDF correction by fixing them at the viewing angle in the case of GOCI geostationary satellite.
- 광학위성에서 관측한 태양광 분광채널에 대한 지표반사도의 공간정보는 육상지역 식생의 변화 특성, 토지피복 분류 그리고 에어러솔광학두께 산출 시 지표 배경반사도 특성과 같이 많은 분야에서 활용되고 있다(Jeong et al., 2012; Yeom et al., 2020; 2021; 2022). 뿐만 아니라 기후변화로 인한 육상 지표면 기반 복사강제력 변동성 연구(Lofgren, 1995)에도 활용이 가능하다. 본 연구에서는 한반도 지역에 대한 정지궤도위성 기반 BRDF 보정 반사도를 산출하였다. GOCI 위성의 경우 한반도 주변의 해양의 광학특성을 광역적으로 관측하기 위해 발사되어 2011년 4월 1일부터 공식적으로 자료를 배포하였다. GOCI 위성이 해양관측 센서로 개발되었지만, 탑재된 분광채널은 육상 식생지수 산출 및 생육 특성을 모니터링도 가능하기 때문에 육상활용 연구가 많이 수행되었다(Jeong et al., 2012; Yeom et al., 2020; Yeom et al., 2021). 무엇보다 동북아시아 지역에 시간해상도가 높은 지표반사도 및 식생지수를 산출할 수 있다는 것은 위성활용 분야에 유의미한 특성을 가진다. 산출된 BRDF 보정 지표반사도는 동북아시아 지역에 대한 논 재배지역 분류(Yeom et al., 2020)와 북한지역 벼 생산량 예측(Jeong et al., 2021)과 같은 연구들에 활용되었다.
1. 서론
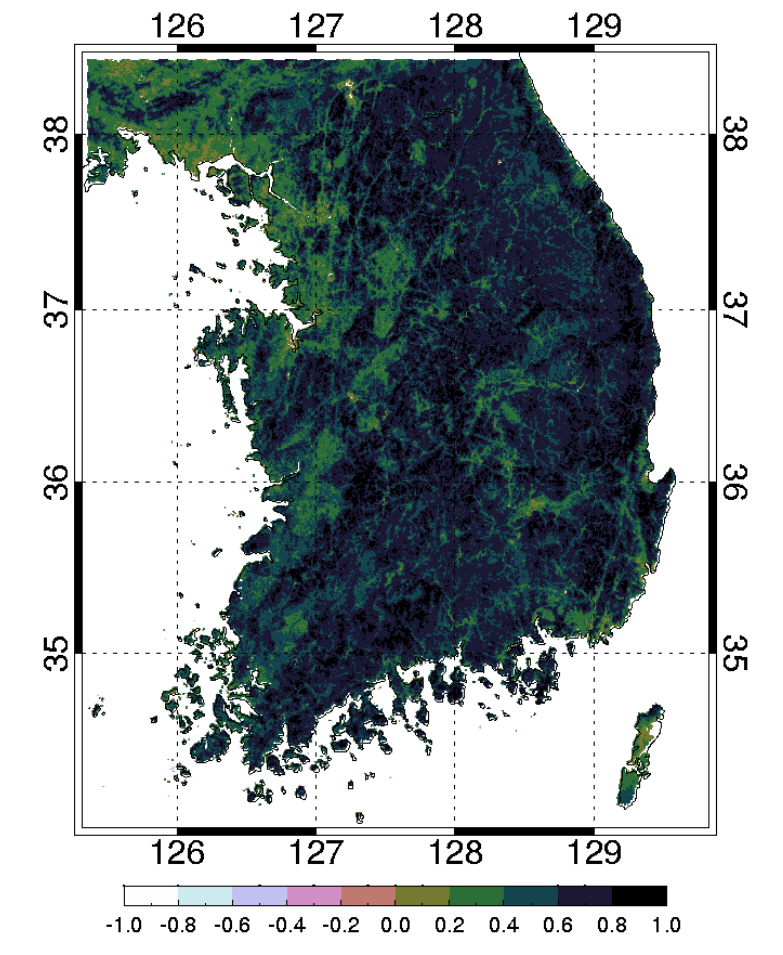
- BRDF 보정 지표반사도를 산출하기 위해 먼저 GOCI 위성에서 관측된 대기상단 반사도에 대한 대기보정을 우선적으로 수행하였다. 본 연구에서는 6S 복사전달모델을 이용하여 GOCI위성의 8개 분광채널에 대한 지표반사도를 산출하였다. 산출된 지표반사도는 지표반사의 양방향성 오차 보정을 위해 반경험적 BRDF 모델을 적용하였다(Roujean et al., 1992; Schaaf et al., 2002). 이는 반경험적 모델이 기존의 지구관측위성의 관측 특성에서 지표의 산란특성을 분해하는데 효과적일 뿐만 아니라, 모델의 정확도 또한 높기 때문이다. 앞에서 언급한 봐와 같이 BRDF 모델링 위해서는 최소 7개의 청천 화소가 필요하다. 지표반사도 청천 화소를 이용하여, 모델의 각 커널의 계수를 산출할 수 있다. 커널은 총 3개의 요소로 구분되며, 반경험적 모델의 경우에는 Isotropic scattering, Geometric scattering, 그리고 Volumetric scattering 함수의 계수로 정의된다. 최종적으로 산출된 BRDF 커널계수를 이용하여 태양평균각 그리고 위성 보기각에 따른 GOCI BRDF 보정 지표반사도 값을 산출하였다(Yeom et al., 2013; 2015). 오전 9시부터 오후 4시까지 1시간 해상도를 가지는 BRDF 보정 지표반사도를 산출하였고, 전체 기간은 2011년 4월부터 2012년 12월까지이다. Fig. 1은 BRDF 보정된 지표반사도를 이용하여 산출한 한반도 지역 정규식생지수에 대한 지도이다. 참고로, 본 자료는 2011년 4월부터 2012년 12월까지 자료이기 때문에 전체 용량은 압축 시 약 180Giga byte 파일 크기를 가진다. 따라서 대용량 자료를 웹페이지에 올리기에는 한계가 있기 때문에 GEO DATA 저널 웹페이지에는 2011년 4월 1일날 오전 9시 자료를 샘플자료로 제공한다. 전체 파일을 원하는 사용자는 교신저자에게 자료를 요청하면 제공가능하다. 자료 형식은 32 bit float binary 파일이고, 가로와 세로의 크기는 각각 990이다.
2. BRDF 보정 지표반사도(BAR)
- BRDF 보정 지표반사도는 위도 34 °N to 39 °N 와 경도 125 °E to 130 °E 범위(Fig. 1) 로 남한지역에 대한 공간 영역이다. 지표반사도 산출 공간해상도는 GOCI 위성 채널 공간해상도와 동일하게 500 m 해상도를 가진다.
3. 공간적 범위
- GOCI 위성기반 BRDF 보정 지표반사도 지도는 오전 9시부터 오후 4시까지 매시간마다 8개의 BAR 자료가 산출되었으며, 전체 기간은 2011년 4월부터 2012년 12월까지이다.
4. 시간적 범위
-
Acknowledgements
- 본 과제는 한국항공우주연구원 위성활용사업(FR21J00)에서 수행되었다.
Fig. 1.NDVI map from BRDF-Adjusted Surface Reflectance based on GOCI geostationary imagery over Korea Peninsula in 2012.
- Jeong S, et al (2012) Development of Variable Threshold Models for detection of irrigated paddy rice fields and irrigation timing in heterogeneous land cover. Agric Water Manag 115:83–91Article
- Jeong S, Ko JH, Yeom JM (2021) The spatial data of paddy rice classification over Northeast Asia using COMS geostationary satellite. Geo Data 3(1):18–22ArticlePDF
- Lofgren BM (1995) Surface Albedo-Climate Feedback Simulated Using Two-Way Coupling. J Clim 8(10):2543–2562Article
- Roujean JL, Leroy M, Deschamps PY (1992) A bidirectional reflectance model of the Earth’s surface for the correction of remote sensing data. J Geophys Res 97(D18):20455–20468Article
- Schaaf CB, et al (2002) First operational BRDF, albedo and nadir Reflectance Products from MODIS. Remote Sens Environ 83(1-2):135–148
- Vermote EF, et al (1997) Second Simulation of the Satellite Signal in the Solar Spectrum, 6S: An Overview. IEEE Trans Geosci Remote Sens 35(3):675–686Article
- Yeom JM, Kim HO (2013) Feasibility of using Geostationary Ocean Color Imager (GOCI) data for land applications after atmospheric correction and bidirectional reflectance distribution function modelling. Int J Remote Sens 34(20):7329–7339
- Yeom JM, Kim HO (2015) Comparison of NDVIs from GOCI and MODIS Data towards Improved Assessment of Crop Temporal Dynamics in the Case of Paddy Rice. Remote Sens 7(1):11326–11343Article
- Yeom JM, et al (2020) Thin cloud detection over land using background surface reflectance based on the BRDF model applied to Geostationary Ocean Color Imager (GOCI) satellite data sets. Remote Sens Environ 239:111610Article
- Yeom JM, et al (2021) Mapping rice area and yield in northeastern asia by incorporating a crop model with dense vegetation index profiles from a geostationary satellite. GIsci Remote Sens 58(1):1–27Article
- Yeom JM, et al (2022) Estimation of the Hourly Aerosol Optical Depth from GOCI Geostationary Satellite Data: Deep Neural Network, Machine Learning, and Physical Models. IEEE Trans Geosci Remote Sens In pressArticle
참고문헌
Appendix
Figure & Data
References
Citations
Citations to this article as recorded by 
 PubReader
 ePub Link
 Cite
Cite

Editorial Office of GEO DATA

#816, 8-13, Gwangpyeong-ro 56-gil, Gangnam-gu, 06367 Seoul, South Korea
Tel: +82-2-6677-5682 E-mail: geodata@gaidas.org
Corporate registration number: 780-82-00418