
Articles
- Page Path
- HOME > GEO DATA > Volume 5(4); 2023 > Article
-
Original Paper
기후 변화 시나리오에 따른 지리산, 한라산 지역의 고해상도 생물기후 자료 -
이상훈1
 , 홍승범2,*, 이경은3
 - High-Resolution Bioclimatic Variables in Mt. Jirisan and Hallasan under Climate Change Scenario
-
Sanghun Lee1, Seungbum Hong2,*, Kyungeun Lee3
-
GEO DATA 2023;5(4):314-320.
DOI: https://doi.org/10.22761/GD.2023.0039
Published online: December 20, 2023
1팀장, 국립생태원, 충청남도 서천군 마서면 금강로 1210, 33657, 대한민국
2선임연구원, 국립생태원, 충청남도 서천군 마서면 금강로 1210, 33657, 대한민국
3전임연구원, 국립생태원, 충청남도 서천군 마서면 금강로 1210, 33657, 대한민국
1Team Leader, National Institute of Ecology, 1210 Geumgang-ro, Maseo-myeon, Seocheon-gun, 33657 Chungcheongnam-do, South Korea
2Senior Researcher, National Institute of Ecology, 1210 Geumgang-ro, Maseo-myeon, Seocheon-gun, 33657 Chungcheongnam-do, South Korea
3Associate Researcher, National Institute of Ecology, 1210 Geumgang-ro, Maseo-myeon, Seocheon-gun, 33657 Chungcheongnam-do, South Korea
- Corresponding Author Seungbum Hong Tel: +82-41-950-5611 E-mail: sbhong@nie.re.kr
Copyright © 2023 GeoAI Data Society
This is an Open Access article distributed under the terms of the Creative Commons Attribution Non-Commercial License (http://creativecommons.org/licenses/by-nc/3.0/) which permits unrestricted non-commercial use, distribution, and reproduction in any medium, provided the original work is properly cited.
- 764 Views
- 81 Download
Abstract
- Many endemic and rare species live in Korea’s subalpine zone, but there have been many research results showing that alpine creatures are disappearing due to recent climate change. Therefore, in this study, bioclimatic variables with 100 m resolution were created for Mt. Jirisan and Mt. Hallasan, representative mountainous regions in Korea. Nineteen high-resolution bioclimatic variables were created for the current and 4 future periods, and the generated data is believed to represent topographical characteristics well. This data is expected to be useful to predict potential habitats through species distribution modeling and the impact of climate change on organisms limited to alpine regions.
- 기후 변화는 현재 우리나라뿐만 아니라 전 세계적으로 진행되고 있으며, 인간생활 및 생태계에 직간접적으로 많은 영향을 끼치고 있다. 특히 기후 변화는 고산 지역과 같이 고립되어 있는 지역에서 그 영향이 크다. 우리나라의 경우 한라산, 지리산 등의 고산 지역에서는 구상나무, 분비나무, 가문비나무, 주목, 눈측백, 눈잣나무, 눈향나무 등 상록침엽수들이 서식하고 있다(Park et al., 2020). 특히 구상나무의 경우 2011년과 2017년을 비교한 결과 대부분의 직경급에서 개체 수가 감소하고 있으며, 총 개체 수의 경우도 감소하고 있는 것으로 나타났다(Song et al., 2021). 구상나무와 비슷한 고도에 서식하고 있는 가문비나무의 경우 훨씬 개체 수가 적기 때문에 한 번 기후 변화의 영향을 받으면 그 영향은 클 것으로 예측된다. 이러한 기후 변화에 따른 생물종의 서식지 변화에 대한 영향과 대책 마련을 위한 미래 생물종 분포 변화 예측을 위해서는 생물기후 변수(bioclimatic variables, Bioclim)가 매우 중요한 요소이다(Araújo et al., 2005). 따라서 생물종의 미래 분포를 예측하기 위해서는 종분포모형(species distribution model)이 널리 활용되고 있으며, 종분포모형을 통한 미래잠재서식지 변화 예측을 위해서는 생물기후 변수가 필수적이다(Attorre et al., 2007; Koo et al., 2015). 생물기후 변수는 기후 변화 시나리오에 따른 전 지구 기후 변화 예측 모델(global climate model)을 통해 예측된 미래의 월별 기온 및 강수량 자료를 이용하여 계산된다. 현재 생물기후 변수는 World Clim (www.worldclim.org)에서 제공하고 있으며, 자료의 해상도는 약 1 km로 좁은 지역을 대상으로 모델링을 하기에는 해상도가 낮다. 따라서 우리나라의 한라산과 지리산 같은 고산지역의 개체 수가 적은 생물에 대하여 종분포모델링을 하기 위해서는 미소서식지의 특성을 반영할 수 있는 고해상도의 생물기후 변수 자료가 필요하다. 본 연구에서는 아고산 지역 등 좁은 지역에서 기후 변화 영향을 받는 생물종의 분포를 분석하기 위하여 한라산, 지리산을 대상으로 100 m 해상도의 생물기후 변수를 생성하였다.
1. 서론
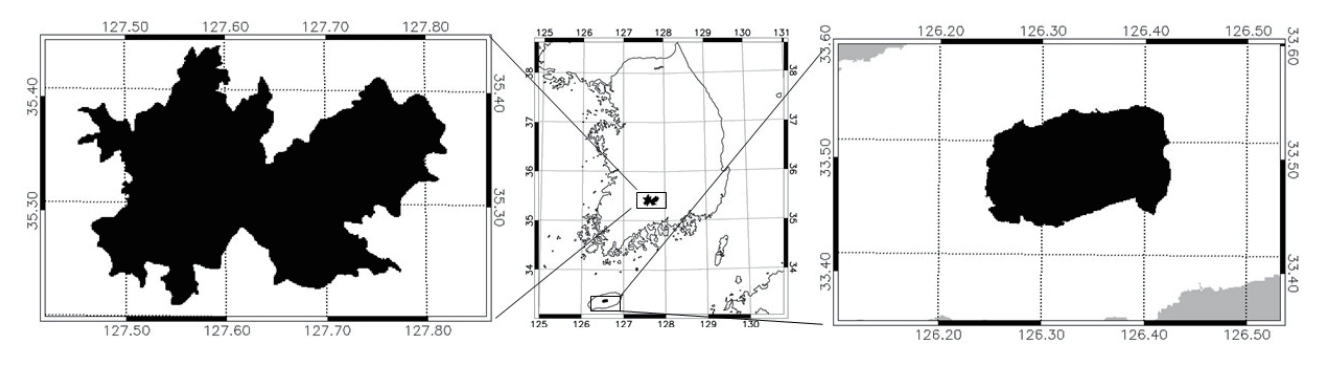
- 한랭·건조한 아고산 지역은 식물들이 상당히 제한적으로 서식하며, 생장속도가 매우 느리고 생육기간이 짧아 환경 변화에 매우 민감하게 반응한다. 특히 기후 변화로 인해 기온이 상승할 경우 주로 서식하는 식물의 분포가 감소할 뿐만 아니라 절멸할 위험성이 높을 것으로 예측되고 있다(Horikawa et al., 2009). 우리나라의 대표적인 아고산 지역은 한라산, 지리산 등이 있으며, 이런 지역에는 개체 수나 종 수가 적은 식물들이 서식하고 있으며, 기후 변화로 인해 취약함에도 불구하고 기후 변화 영향평가 및 미래 잠재서식지 예측을 위한 아고산 지역 특성에 맞는 고해상도 자료가 부재한 실정이다. 이에 본 연구에서는 지리산과 한라산을 대상으로 종분포모델링을 통한 잠재서식지 예측을 하기위한 고해상도 생물기후 변수 자료를 생성하였다(Fig. 1).
- 고해상도 생물기후 변수를 생성하기 위해서는 먼저 대상지역에 대한 관측 자료 및 기후 시나리오 자료가 필요하다. 관측 자료는 기상청에서 제공하고 있는 ASOS와 AWS로부터 기온(일평균, 일최고, 일최저)과 일 강수량 자료가 사용되었으며, 기후 시나리오 자료는 PRIDE 기반 미래 고해상도 격자 자료 생산 방법을 통해 얻어진 12.5 km 해상도의 자료가 사용되었다(Kim et al., 2016; Korea Meteorological Administration, 2012). 관측 자료를 이용하여 Kim et al. (2012)에서 사용된 MK-PRISM 방법을 이용하여 한라산과 지리산의 월별 고해상도 기후 자료가 생성되었다. 이렇게 생성된 기후시나리오 자료에 KM-PRISM에서 생성된 100 m 해상도의 자료를 접목하여 고해상도 기후 시나리오 자료가 생성되었다(Hong et al., 2020).
- 앞에서 생성된 100 m 해상도의 고해상도 기후자료의 월평균 강수량, 월 최대기온, 월 최소기온을 각각 평균하여 R 프로그램의 dismo 패키지를 활용하여 최종적인 19개 생물 기후 변수를 생성하였다(Table 1). 각 변수별 산출 방법은 Karger et al. (2017)의 방법과 같다. 지리산과 한라산을 대상으로 종분포모델링에 필요한 생물기후 변수를 RCP 시나리오에 기반한 100 m 고해상도 기후예측자료를 이용하여 20년씩 5개 시기에 대하여 총 19개의 생물기후 변수를 각각 생성하였다. 현재 시기는 2000-2017년, 2040s는 2021-2040년, 2060s는 2041-2060년, 2080s는 2061-2080년, 2100s는 2081-2100년으로 선정하여 각 기간에 맞는 자료가 생성되었다. 또한 각 기후 변화 예측 시기별로 2040s, 2060s, 2080s, 2100s는 RCP 4.5와 RCP 8.5에 해당하는 생물기후 변수를 생산하였다.
2. 대상지역 및 연구 방법
- 본 연구에서는 우리나라의 대표적인 아고산 지역인 지리산과 한라산을 대상을 미래 서식적합지 예측이 가능한 기후 시나리오를 적용한 100 m 해상도의 19개 생물기후 변수를 생성하였다. 100 m 해상도의 자료는 기존에 World Clim에서 제공하고 있는 1 km 해상도에 비해 고해상도 자료이며, 아고산 지역에서 개체 수와 종 수가 적은 미소서식지에 살고있는 식물에 대하여 충분히 미래 서식적합지를 예측하는 데 유용할 것으로 판단된다. Fig. 2는 지리산과 한라산의 현재 기온과 21세기말 간의 기온차를 나타내는데, 균일하게 월평균 기온 상승만 나타날 뿐 월 간 기온 변화폭은 크게 바뀌지 않는 것으로 예측되었다.
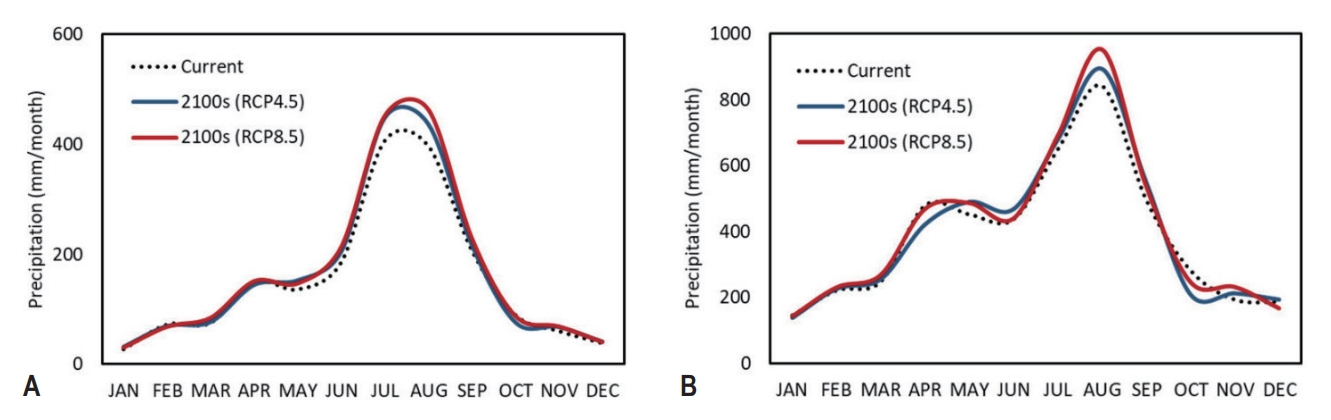
- Fig. 3은 강수예측 결과에 대한 그래프로 21세기 말에도 여름철 강수 집중 시기의 변화는 달라지지 않을 것으로 예측되었으며, 현재 대비 전체 강수량은 모든 계절에서 소폭 상승하는 것으로 나타났다.
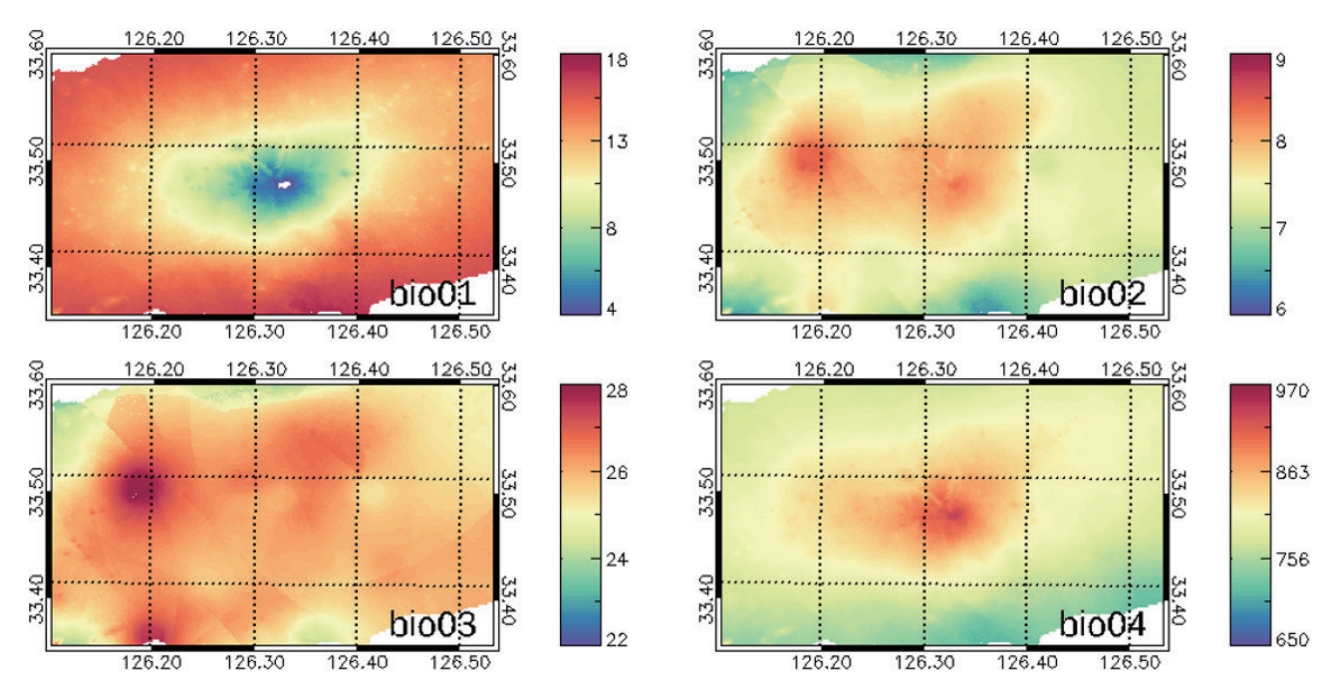
- Fig. 4는 본 연구에서 도출한 19개 생물기후 변수 중 기온과 관련한 변수(bio01-bio04)로서, 고해상도의 지형적 특성들이 뚜렷하게 구현되었음을 알 수 있다. 생물기후 변수 bio1에서 bio11까지는 기온과 관련이 있는 변수들로 고도의 변화에 따른 기온이 변화하는 모습을 잘 나타내고 있으며, 생물기후 변수 bio12에서 bio19까지는 강수와 관련된 자료로서 고도와는 크게 관련성이 없이 방향 등의 자료에 더 영향을 받는 결과를 보여주었다. 그리고 기온과 강수의 계절성을 나타내는 bio4에서 bio15까지는 방향의 영향을 많이 받는 것으로 나타났다(Figs. 4, 5).
- 본 연구에서는 아고산 지역에서 제한적으로 서식하고 있는 생물들에 대한 기후변화 영향 평가 및 종분포모델링을 통한 잠재서식지 예측이 가능한 100 m 해상도의 생물기후 변수 자료를 현재와 미래 기간별 RCP 4.5와 8.5에 대하여 생성하였다. 생성된 고해상도 생물기후 변수 자료는 아고산 지역의 살고 있는 생물들에 대한 연구에 유용하게 쓰일 것으로 기대된다.
3. 결과
-
Conflict of Interest
Sanghun Lee has been an Editorial Board of GEO DATA; however, he was not involved in the peer reviewer selection, evaluation, or decision process of this paper. Otherwise, no other potential conflicts of interest relevant to this paper were reported.
-
Funding Information
This study was funded by the project, “Assessment of climate change risk and adaptation strategy research for ecosystem in Korea”, grant numbers NIE-B-2023-35.
-
Data Availability Statement
The data that support the findings of this study are openly available in [EcoBank] at http://doi.or.kr/10.22756/GEO.20230000000832 and http://doi.or.kr/10.22756/GEO.20230000000833.
Notes


- Araújo MB, Whittaker RJ, Ladle RJ, Erhard M (2005) Reducing uncertainty in projections of extinction risk from climate change. Glob Ecol Biogeogr 14(6):529–53ArticlePDF
- Attorre F, Alfo M, Sanctis MD, Franceconi F, Bruno F (2007) Comparison of interpolation methods for mapping climatic and bioclimatic variables at regional scale. Int J Climatol 27(13):1825–1843Article
- Hong S, Jang I, Jeong HM, et al (2020) Assessment of climate change risks and adaptation strategy research for ecosystem in Korea. National Institute of Ecology, Seocheon, p. 97–99
- Horikawa M, Tsuyama I, Matsui T, Kominami Y, Tanaka N (2009) Assessing the potential impacts of climate change on the alpine habitat suitability of Japanese stone pine (Pinus pumila). Landsc Ecol 24:115–128ArticlePDF
- Karger D, Conrad O, Böhner J, et al (2017) Climatologies at high resolution for the earth’s land surface areas. Sci Data 4(1):170122ArticlePubMedPMCPDF
- Kim MK, Han MS, Jang DH, et al (2012) Production technique of observation grid data of 1km resolution. J Clim Res 7(1):55–68
- Kim MK, Kim S, KIm J, et al (2016) Statistical downscaling for daily precipitation in Korea using combined PRISM, RCM, and quantile mapping: part 1, methodology and evaluation in historical simulation. Asia-Pacific J Atmos Sci 52:79–89ArticlePDF
- Koo KA, Kong WS, Nibbelink NP, Hopkinson CS, Lee JH (2015) Potential effects of climate change on the distribution of cold-tolerant evergreen broadleaved woody plants in the korean peninsula. PloS One 10(8):e0134043ArticlePubMedPMC
- Korea Meteorological Administration (2012) Korean peninsula climate change outlook report. Meteorological Administration, Daejeon, p. 16–23
- Park HC, Moon GS, Lee H, Lee NY (2020) A study on the spatial information and location environment of dead coniferous tree in subalpine zone in Jirisan National Park. Korean J Environ Ecol 34(1):42–54Article
- Song JH, Han SH, Lee SH, Yun CW (2021) Ecological characteristic of Abies koreana stand structure of Mt. Jirisan and Mt. Hallasan. J Korean Soc For Sci 110(4):590–600
References
Appendix
MetaData for Dataset
| Sort | Field | Subcategory#1 | Subcategory#2 |
|---|---|---|---|
| Essential | *Title | High-resolution Bioclimatic Variables in Mt. Jirisan and Hallasan under Climate Change Scenario | |
| *DOI name | http://doi.or.kr/10.22756/GEO.20230000000832 | ||
| http://doi.or.kr/10.22756/GEO.20230000000833 | |||
| *Category | Biota | ||
| Abstract | |||
| *Temporal Coverage | 100 years | From 2000 to 2100 | |
| *Spatial Coverage | Address | ||
| WGS84 Coordinates | Polygon | ||
| Mt. Hallasan | |||
| Latitude 33.30 to 33.60 | |||
| Longitude 126.10 to 126.55 | |||
| Mt. Jirisan | |||
| Latitude 35.20 to 35.45 | |||
| Longitude 127.40 to 127.85 | |||
| *Personnel | Name | Sanghun Lee | |
| Affiliation | National Institute of Ecology | ||
| sanghunlee@nie.re.kr | |||
| *CC License | CC-BY-NC | ||
| Optional | *Project | Assessment of climate change resks and adaptation strategy research for ecosystem in Korea | |
| *Instrument | R dismo |
Figure & Data
References
Citations
 PubReader
 ePub Link
 Cite
Cite


#816, 8-13, Gwangpyeong-ro 56-gil, Gangnam-gu, 06367 Seoul, South Korea
Tel: +82-2-6677-5682 E-mail: geodata@gaidas.org
Corporate registration number: 780-82-00418
