
Articles
- Page Path
- HOME > GEO DATA > Volume 3(1); 2021 > Article
-
Article
Space Science
천리안 정지궤도위성을 이용한 동북아시아 지역 논 분류 지도 데이터 - 정승택1, 고종한2, 염종민1,*
- The spatial data of paddy rice classification over Northeast Asia using COMS geostationary satellite
- Seungtaek Jeong1, Jonghan Ko2, Jong-Min Yeom1,*
-
GEO DATA 2021;3(1):18-22.
DOI: https://doi.org/10.22761/DJ2021.3.1.003
Published online: March 31, 2021
1한국항공우주연구원 위성활용부, 대전 34133, 대한민국
2전남대학교 응용식물학과, 광주 61186, 대한민국
1Satellite Application Division, Korea Aerospace Research Institute, Daejeon 34133, Republic of Korea
2Applied Plant Science, Chonnam National University, Gwangju 61186, Republic of Korea
- *Corresponding author: yeomjm@kari.re.kr
Copyright © 2021 GeoAI Data Society
This is an Open Access article distributed under the terms of the Creative Commons Attribution Non-Commercial License (http://creativecommons.org/licenses/by-nc/3.0/) which permits unrestricted non-commercial use, distribution, and reproduction in any medium, provided the original work is properly cited.
- 469 Views
- 13 Download
- 2 Crossref
요약문
- 한국항공우주연구원은 정지궤도 위성인 천리안(COMS: Communication, Ocean and Meteorological Satellite)을 기반으로 동북아시아 지역에 대한 논(paddy field) 분류를 수행했다. 논 분류 지도는 농업뿐만 아니라, 기후, 환경, 바이오 에너지, 그리고 생태 분야에서도 활용도가 높다. 본 연구에서 제작한 동북아시아에 대한 논 지도의 공간 해상도는 500 m이고 제공되는 자료 시기는 2011년부터 2017년까지 연도별 자료이다. 공간적인 관측 범위는 위도 25 ° N ~ 47 ° N와 경도 115 ° E ~ 145 ° E 범위로 우리나라, 일본, 북한, 중국 동북 3성(헤이룽장성, 지린성, 랴오닝성)을 포함한다. 논 분류 지도를 제작하기 위해 천리안 정지궤도 위성에 탑재된 해색센서(Geostationary Ocean Color Imager, GOCI)로부터 산출된 Normalized Difference Vegetation Index (NDVI)와 보조 자료로 MODerate Resolution Imaging Spectroradiometer (MODIS)로부터 산출된 Land Surface Water Index (LSWI)를 이용했다. 먼저 GOCI 위성에서 관측되는 대기 상단의 복사값을 대기보정을 통해 캐노피 상단의 지표반사도로 보정했고, 지표반사도로부터 벼의 시계열 생육 특성을 반영할 수 있는 NDVI를 산출했다. 그리고 벼 이앙 시기에 논에서 나타나는 GOCI NDVI와 MODIS LSWI의 시계열 특성을 반영하여 최종적으로 동북아시아 지역에 대한 논 분류 지도를 산출했다. 산출된 논 분류 지도는 고해상도 위성 기반의 참조 지도를 이용해 검증했다(Accuracy: 78%, Kappa coefficient: 51.2%). 알고리즘에 대한 보다 자세한 내용은 선행 연구에 기술되어 있다.
Abstract
- The Korea Aerospace Research Institute (KARI) estimated paddy rice classification maps over Northeast Asia using the Cheonian geostationary orbiting satellite (COMS: Communication, Ocean and Meteorological Satellite) data. In the case of classification map of rice paddy, it is not only used as input data for estimating rice yield, but also for various fields such as agriculture, weather, climate change, bio energy, and ecology. The spatial resolution of the classified rice map is 500 m, and the classification map was estimated yearly temporal resolution from 2011 to 2017. The spatial coverage of the classification map was the Northeast Asia with the latitude 25 ° N ~ 47 ° N and the longitude 115 ° E ~ 145 ° E as shown in Fig. 1 including Heilongjiang Sheng, Jilin Sheng, and Liaoning Sheng. In this classification map of paddy rice, it was calculated by applying geostationary orbiting satellites based on value-added products from Geostationary Ocean Color Imager (GOCI). In this study, we additionally used MODIS Land Surface Water Indices (LSWI) to support rice classification by considering the physical characteristics of rice cultivation area in the transplanting season. Basically, the radiance value of the top of atmosphere (TOP) observed in GOCI satellite was corrected to the surface reflectance at the top of the canopy through radiative transfer model. After that, NDVI, which can reflect the time series growth characteristics of rice, was estimated first. In addition, the MODIS LSWI index was used to determine the rice cultivation area with the NDVI in Northeast Asia by reflecting the water characteristics of the rice cultivation area during the transplanting period. More details of validation results for this algorithm can be found in previous studies.
- 논(paddy field) 분류 지도는 벼의 생산성 산출을 위한 입력 자료로 활용될 수 있을 뿐만 아니라, 환경, 바이오 에너지, 지표 생태계 분석 등 다양한 분야에 기초 자료로 활용할 수 있다(Yeom et al., 2021). 그러나 현재 공식적으로 제공되는 위성영상 기반의 논 지도는 업데이트 주기가 느리고, 세 분류 항목(예: 논, 밭, 과수원 등)이 제공되지 않는다. 한국항공우주연구원에서는 천리안 정지궤도 해색위성(Geostationary Ocean Color Imager, GOCI)을 이용해 동북아시아 지역에 대한 논에 대한 연도별 분류 지도를 산출했다. 산출된 동북아시아 논 분류 지도의 공간해상도는 500 m이며, 2011년부터 2017년까지 연도별로 제작됐다. 관측 영역의 공간 범위는 그림 1과 같이 위도 30 ° N ~ 47 ° N, 경도 119 ° E ~ 146 ° E 영역에 동북아시아 지역을 대상으로 수행했다.
1. 서론
- 논 분류를 위해 먼저 COMS 정지궤도 위성의 GOCI로부터 분광반사도를 산출해 NDVI를 계산했으며, 논 지역을 대상으로 NDVI의 최소, 최대, 증가율 등의 식생지수 시계열 특징을 임계값으로 정의하고 조건을 적용했다. 추가적으로 MODIS LSWI를 활용해 Xiao et al. (2005)가 제안한 논에서의 NDVI와 LSWI 특징을 이용한 분류 조건을 적용했다. 이것은 일반적으로 작물을 포함한 대부분의 식생에서의 NDVI가 LSWI보다 높은 특성을 갖지만, 논의 경우 관개가 이뤄질 경우 관개수의 영향으로 수분지수인 LSWI가 일시적으로 높아지고 식생지수인 NDVI가 낮아지면서 두 지수의 값 관계가 역전되는 특성이다. 명확한 이론적 특성과 높은 신뢰도, 쉬운 적용방법 등의 장점 때문에 논 분류를 위한 많은 선행 연구들에서 이 개념이 채택되어 사용되어 왔다(Jeong et al., 2012; Peng et al., 2017). LSWI는 근적외(Near-infrared, NIR)와 단파적외(Short wave infrared) 밴드가 필요하지만 GOCI 센서에는 단파적외 밴드가 없기 때문에 본 연구에서는 MODIS 자료를 추가적으로 이용했다. 그 외 자세한 논 분류 방법은 Yeom et al. (2021)에 기술되어 있다.
- 분류된 지도는 우리나라 환경부에서 제작한 고해상도의 중분류 토지피복도를 이용해 통계적 검증을 수행했으며, 그 결과 전체 정확도가 78%, Kappa coefficient는 51.2%로 적정 신뢰도를 가지는 것으로 나타났다. Fig. 1은 공간적 분포 특성으로 한반도의 경우 서쪽 평야지역을 대상으로 논이 발달 되어있는 특성을 잘 보여주고 있으며, 중국은 북동부 지역에 가장 많은 논이 분포하고 있는 결과를 나타냈다. 일본의 경우 주로 중동부 지역과 해안가의 평야지대를 중심으로 논이 분포하는 결과를 보였다. 본 연구에 제시 되진 않았으나 2011년부터 2017년까지 연구 지역의 전체 논 면적이 점차 감소하는 경향을 나타냈다. 본 알고리즘에 대한 자세한 검증 결과는 Yeom et al. (2021)에서 확인할 수 있다.
2. 분류방법
- 논 분류 지도는 Fig. 1에서 보여지는 봐와 같이 위도 25 ° N ~ 47 ° N와 경도 115 ° E ~ 145 ° E 범위로 남한, 북한, 일본, 중국 동북 3성(헤이룽장성, 지린성, 랴오닝성)을 포함하는 동북아시아 영역이다. 공간해상도는 GOCI 위성의 가시채널 해상도와 동일한 500 m이다.
3. 공간적 범위
- 동북아시아 논 분류 지도는 2011년부터 2017년월까지 연도별로 총 7개 년도 지도가 제작됐다.
4. 시간적 범위
-
Acknowledgements
- 본 과제는 한국항공우주연구원 위성활용사업(FR21J00)에서 수행되었다.

- Jeong S, Kang S, Jang K, Lee H, Hong S, Ko D (2012) Development of Variable Threshold Models for detection of irrigated paddy rice fields and irrigation timing in heterogeneous land cover. Agricultural Water Management 115:83–91Article
- Peng D, Huete AR, Huang J, Wang F, Sun H (2011) Detection and estimation of mixed paddy rice cropping patterns with MODIS data. International Journal of Applied Earth Observation and Geoinformation 13(1):13–23Article
- Xiao X, Boles S, Liu J, Zhuang D, Frolking S, Li C, Salas W, Moore B III (2005) Mapping paddy rice agriculture in southern China using multi-temporal MODIS images. Remote sensing of environment 95(4):480–492Article
- Yeom JM, Jeong S, Deo RC, Ko J (2021) Mapping rice area and yield in northeastern asia by incorporating a crop model with dense vegetation index profiles from a geostationary satellite. GIScience & Remote Sensing 1–27Article
참고문헌
Appendix
Figure & Data
References
Citations
- The Spatial Maps of Paddy Rice Yield over Northeast Asia Using COMS Geostationary Satellite and Reanalysis Meteorological Data
Seungtaek Jeong, Jonghan Ko, Jong-Min Yeom
GEO DATA.2021; 3(2): 20. CrossRef - The Map Data of BRDF-Adjusted Surface Reflectance from GOCI Geostationary Satellite Imagery over Korean Peninsula
Jong-Min Yeom
GEO DATA.2021; 3(4): 66. CrossRef
 PubReader
 ePub Link
 Cite
Cite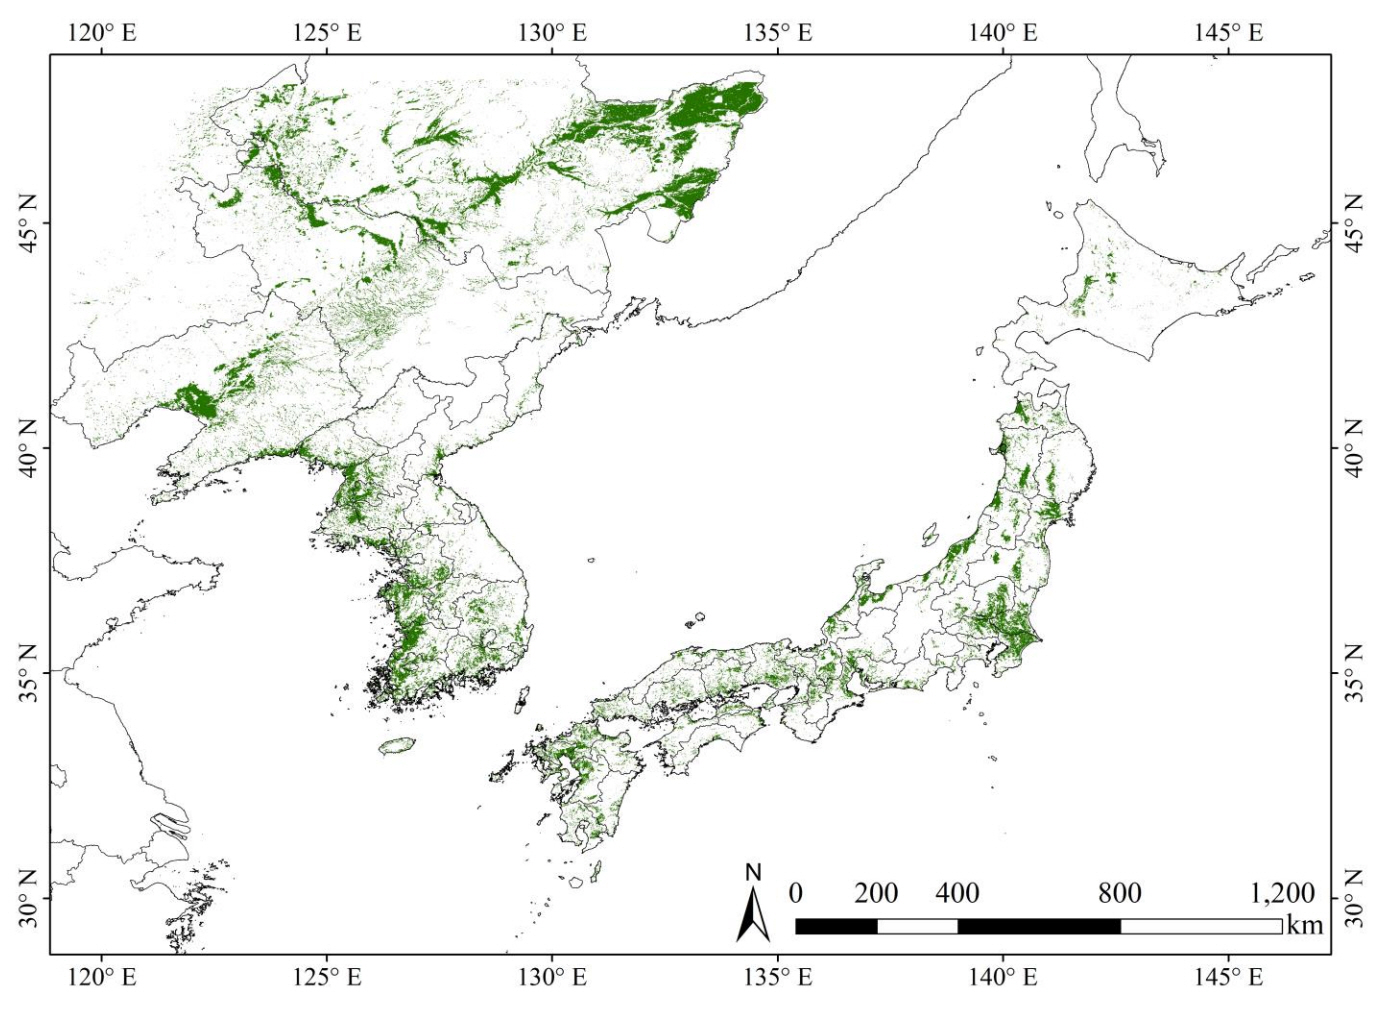

#816, 8-13, Gwangpyeong-ro 56-gil, Gangnam-gu, 06367 Seoul, South Korea
Tel: +82-2-6677-5682 E-mail: geodata@gaidas.org
Corporate registration number: 780-82-00418
