
Articles
- Page Path
- HOME > GEO DATA > Volume 5(3); 2023 > Article
-
Original Paper
연안 및 호수 환경에서 적용 가능한 고해상도 위성 고도계 수위 변화 추정 -
황도현1
 , 정한철2,*, 이형기3
 - Estimation of Coastal Area and Lake Water Level Changes Using High-Resolution Altimetry
-
Do-Hyun Hwang1, Hahn Chul Jung2,*, Hyongki Lee3
-
GEO DATA 2023;5(3):155-160.
DOI: https://doi.org/10.22761/GD.2023.0030
Published online: September 26, 2023
1박사후연구원, 연세대학교 지구시스템과학연구소, 서울특별시 서대문구 연세로 50, 03274, 대한민국
2부교수, 연세대학교 지구시스템과학과, 서울특별시 서대문구 연세로 50, 03274, 대한민국
3교수, 휴스턴대학 토목공학과, UH NCALM, 5000 Gulf Freeway, Bldg. 4, Rm 216, Houston, 77204 TX, 미국
1Post Doctor, Research Center for Earth System Sciences, Yonsei University, 50 Yonsei-ro, Seodaemun-gu, 03722 Seoul, South Korea
2Associate Professor, Department of Earth System Sciences, Yonsei University, 50 Yonsei-ro, Seodaemun-gu, 03722 Seoul, South Korea
3Professor, Department of Civil and Environmental Engineering, University of Houston, UH NCALM, 5000 Gulf Freeway, Bldg. 4, Rm 216, Houston, 77204 TX, USA
- Corresponding Author Hahn Chul Jung Tel: +82-2-2123-2677 E-mail: hahnchul.jung@yonsei.ac.kr
Copyright © 2023 GeoAI Data Society
This is an Open Access article distributed under the terms of the Creative Commons Attribution Non-Commercial License (http://creativecommons.org/licenses/by-nc/3.0/) which permits unrestricted non-commercial use, distribution, and reproduction in any medium, provided the original work is properly cited.
- 537 Views
- 29 Download
Abstract
- Radar satellite altimeters are widely used in offshore areas, whereas they are underutilized in coastal areas due to a number of interference factors. Altimeter satellite data can be used to summarize elevation information at 1 Hz for offshore areas, but for areas close to land, it is more effective to utilize imagery with a resolution of 20 Hz to provide a more detailed representation. The use of highresolution satellite altimeter data is expected to increase the amount of data available for hydrological data such as complex coastlines and small lakes. Therefore, in this study, we investigated the applicability of 20 Hz altimeter data in the Korean Peninsula. First, the accuracy was analyzed by comparing the 20 Hz altimeter data from the Jason-3 satellite with the Ulleungdo tide data. Second, we compared the 20 Hz altimeter data from the Sentinel-3A satellite with the water level data of Soyang Lake to see if it can be applied to land areas. In the case of inland lakes, the water level is estimated to be affected by the discharge volume due to heavy rainfall in summer, and it was determined that the satellite altimeter data can be utilized. Therefore, utilizing the data from this study is expected to improve the accuracy of hydrological analysis in coastal and lake environments.
- 위성 고도계는 레이더 펄스를 이용하여 위성으로부터 지표면까지 도달하는 왕복 시간을 측정하여 높이를 산출한다. 1993년 Topex/Poseidon 위성이 발사된 이후 고도계 자료를 활용하여 해수면 높이를 관측하게 되었으며, 초기에는 주로 외해에서 고도계 측정 연구가 진행되었다. 육지와 가까운 연안 지역은 외해보다 간섭 요인이 많아 고도계 자료를 활용하기 어려웠다. 연안 지역의 50 km 이내 지역은 기술적인 문제로 정확도 향상이 어려웠으며, 고도계로 연안 지역에 대해 관측을 하더라도 외해에 비해 조석의 영향이나 대기압의 급격한 변화, 대류권 보정 정밀도 누락 등 고도계 보정에도 어려움이 있다(Rosmorduc et al., 2018). 1 Hz 자료는 20 Hz 자료를 요약하여 나타내기 때문에 이상치 등이 보정된 평균 값을 제공받을 수 있으나 육지와 가까운 지역에서는 주의해서 활용해야 한다. 따라서 육상과 가까운 연안 지역의 고도계 자료를 활용할 때에는 20 Hz 자료를 사용하는 것이 효과적이라고 볼 수 있다(European Organization for the Exploitation of Meteorological Satellites [EUMETSAT], 2017). 따라서 연안 지역에서도 고해상도 고도계 측정 정보를 활용해볼 수 있을 것으로 판단된다.
1. 서론
- 2.1 연구지역
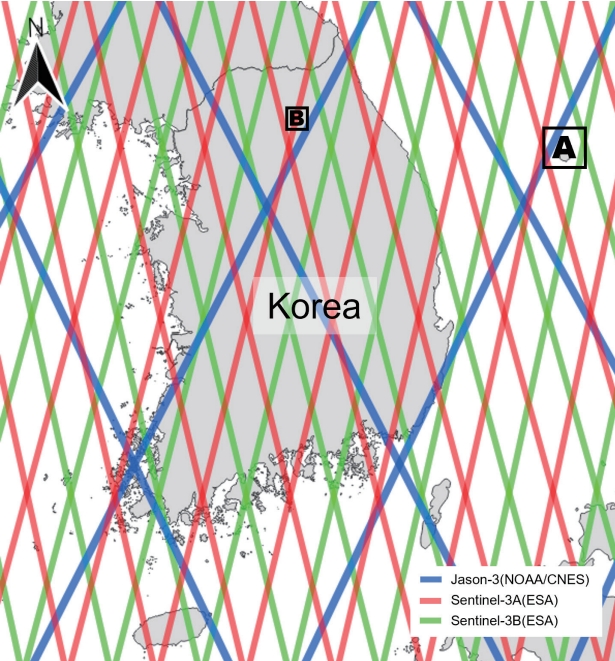
- 한반도 주변을 지나가는 고도계 위성 Jason-3, Sentinel3A/B의 궤도 트랙은 Fig. 1과 같다.
- 두 위성의 궤도가 서로 겹치지 않기 때문에 두 위성을 상호보완적으로 활용한다면 많은 고도계 정보를 수집할 수 있을 것으로 판단되어 Jason-3, Sentinel-3A/B 위성 각각 하나씩 비교해볼 수 있는 연구지역을 선택하였다. 먼저 Fig. 1의 A지역인 울릉도는 Jason-3 위성 궤도와 가까우며, 연안에 비해 조석 등의 영향이 적을 것으로 판단되는 지역이다. 내륙 지역에서 고도계 자료는 강, 호수, 댐 등에서 활용 가능할 것이다. 따라서 Fig. 1의 B지역인 Setinel-3A 위성 궤도와 가까운 국내 최대 호수인 소양호를 선정하였다. 호수는 대부분 담수로 이루어져 있으며, 건기일 때 농업용수로 활용 가능하기 때문에 수자원 관리에 유용한 역할을 할 수 있을 것으로 생각된다.
- 2.2 연구 자료
- Jason-3 위성은 미국 해양 대기청(National Oceanic and Atmospheric Administration), 프랑스 정부 우주국(Centre National d’Études Spatiales, CNES), 유럽 기상 위성 개발 기구(EUMETSAT), 미국 항공 우주국(National Aeronautic and Space Administration) 공동 연구로 개발되었으며, Topex/Poseidon, Jason-1/2의 후속 위성이다. 따라서 Jason-3 위성은 Topex/Poseidon, Jason-1/2 위성과 동일한 궤도 자료를 수집하며, 주기는 10일이다. Jason-3 위성의 레벨2 자료는 Geophysical Data Records (GDR)로 제공되는데, GDR 자료는 데이터 제공 지연 시간 및 해상도에 따라서 Operational GDR (OGDR), Interim GDR (IGDR), GDR로 제공된다. 지연 시간은 각각 3-5시간, 1-2일, 90일 이후 등 세 종류가 있으며, 해상도는 1 Hz, 1 Hz + 20 Hz, 1 Hz + 20 Hz + waveform의 형태로 선택 가능하다. Alongtrack 자료의 1 Hz 해상도는 해양 기준 약 6-7 km이며, 20 Hz의 해상도는 ~300 m이다(Dibarboure et al., 2014). GDR 종류 및 해상도 각각의 형태를 고려하면 9종류로 제공받을 수 있다. Jason-3 위성 고도계 자료의 root mean square error (RMSE)는 2.5 cm로 Jason-2의 3.4 cm에 비해 향상되었다(Bignalet-Cazalet et al., 2021).
- 본 연구에서는 CNES의 Aviso ftp 서버(ftp://ftp-access.aviso.altimetry.fr)에서 1 Hz + 20 Hz 해상도를 가지는 GDR 자료를 다운로드하였다. 우리나라 외해 지역에 대한 고도계 정확도를 확인하기 위하여 울릉도 조위 관측소와 가장 가까운 127번 트랙 자료를 사용하였으며, 조위 자료 활용 가능 기간인 2016년 2월 22일부터 2021년 12월 31일까지 약 5년 자료를 사용하였다(Supplementary Material 1; Altimeter: U1, U2, U3).
- Sentinel-3A/B 위성은 유럽 항공 우주국(European Space Agency, ESA)의 코페르니쿠스 프로그램으로 지구 모니터링을 위한 데이터를 제공한다(Quartly et al., 2020). Sentinel-3A의 자료 수집 주기는 27일이며, synthetic aperture radar (SAR) 모드와 low rate mode (LRM) 모드로 관측된 자료로 레벨2 자료를 생산한다. SAR 모드는 고해상도 along-track 자료를 제공하며, LRM 모드의 경우 발사 초기 테스트 목적으로만 사용된다. 레벨2 자료는 해상도에 따라 reduced (1 Hz), standard (1 Hz + 20 Hz), enhanced (1 Hz, 20 Hz, waveform)로 제공된다. SAR 모드의 1 Hz along-track 해상도는 ~7 km이며, 20 Hz의 경우 ~300 m이다(Peng and Deng, 2020). 시간 지연은 3시간 이내 취득 가능한 Near Real-Time (NRT), 48시간 이내에 취득 가능한 Slow Time Critical (STC), 1달 이후 취득 가능한 Non-Time Critical (NTC) 형태로 제공된다(EUMETSAT, 2017).
- 본 연구에서는 ESA 데이터 허브(https://scihub.copernicus.eu/)에서 standard 모드의 해상도를 가지는 NTC 자료를 사용하였다. 호수 환경에서 수위 정확도를 비교해 보기 위해 Sentinel-3A 궤도 중 소양강 댐과 가장 가까운 트랙 60번을 사용하였다. 연구 기간은 2017년 1월 1일부터 2022년 12월 31일까지 5년 자료를 사용하였다(Supplementary Material 1; Altimeter: S1).
- 고도계로 관측한 높이 자료는 현장 자료와 비교를 통해 정확도를 분석하였다. Jason-3 자료는 한국 해양조사원에서 제공하고 있는 울릉도 지점의 1시간 조위 자료를 사용하여 고도계 관측 시간과 가장 가까운 시간에 일치시켜 비교하였다(Supplementary Material 1; Tide gauge: U). Sentinel-3A 자료는 한국 수자원공사에서 제공하고 있는 소양강댐 수문 자료의 10분별 수위 자료를 사용하여 비교하였다(Supplementary Material 1; Water level: S).
- 2.3 인공위성 자료를 이용한 높이 추정
- 20 Hz 인공위성 고도계 자료를 이용한 고도(H)는 Ep. 1과 같이 계산할 수 있다(Okeowo et al., 2017).
- H는 위성으로 관측하여 추정된 높이이며, Alt는 기준 타원체에서 위성 고도까지 높이, R은 물 표면 높이, ∆R은 재추적된 범위 보정이다. Awet는 습윤 대류권 보정, Adry는 건조 대류권 보정, Aiono는 전리층 보정, Tp는 극 조석 보정, TE는 지구조석 보정, TL는 조석 하중 보정이다.
- Ep. 1을 이용하여 높이를 구한 뒤 조위 및 수위 관측 자료와 비교하였다.
2. 자료 및 방법
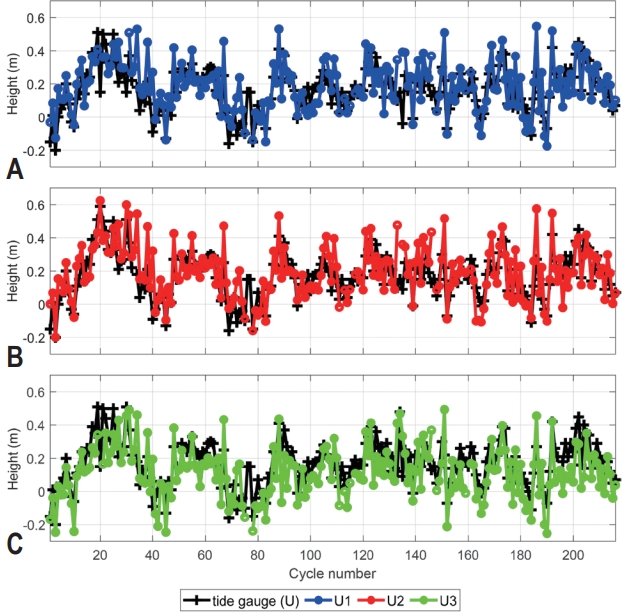
- Fig. 1의 A지역인 외해에서 20 Hz 고해상도 위성 고도계 높이 자료는 7 km에서 관측된 27 포인트 자료를 평균하여 U1, U2, U3으로 나타냈다. U는 한국해양조사원에서 관측하고 있는 울릉도 조위 자료 지점이며, Jason-3 위성의 127번 트랙의 관측 시간과 맞추었다. U2의 중간 지점과 U지점은 약 23 km 떨어져 있으며, 위성 고도계 높이 자료 및 조위 자료 취득 지점은 Fig. 2와 같다. 해수면 높이와 조위 자료는 각각 평균을 뺀 아노말리 자료를 사용하였다.
- U1, U2, U3과 U의 RMSE 값은 각각 0.1 m, 0.11 m, 0.12 m로 연안 지역에서 멀어질수록 낮아지는 경향을 보였다. Peng and Deng (2020)의 연구와 비교하였을 때 RMSE는 0.05-0.2 m였기 때문에 RMSE는 적정 범위로 판단된다.
- 고도계 자료(U1, U2, U3)와 조위 자료(U)를 비교한 그래프는 Fig. 3과 같으며, 해수면 높이 변동 경향성은 대체적으로 유사하게 나타났다. 울릉도는 외해에 위치하고, 조석 현상이 약하기 때문에 연안 지역에 비해 위성 고도계 자료의 정확도는 높게 나타난 것으로 판단된다. 하지만 조석 자료 주기와 위성 고도계 주기가 서로 만나 발생된 조석이 변형된 거짓 신호를 제거한다면 정확도는 더 개선될 것으로 보인다(Yoon, 2001; Youn et al., 2002).
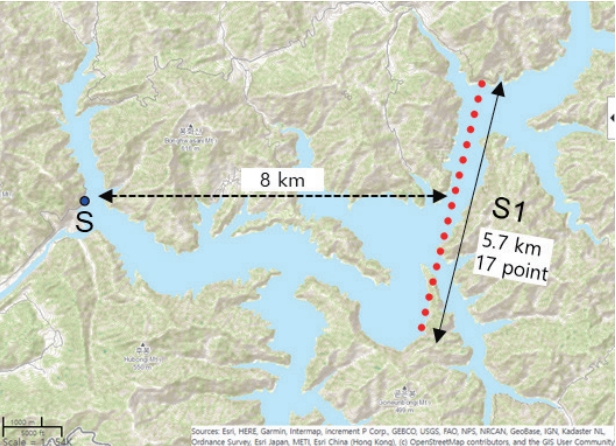
- Fig. 1의 B지역인 호수에서 20 Hz 고해상도 위성 고도계 높이 자료는 Sentinel-3A 60번 트랙이 지나가는 약 5.7 km 지점의 17개 포인트 지점을 평균하여 나타냈다. 고도계 트랙 자료에 호수 주변 육지도 일부 포함되지만, 육지 자료는 제거한 뒤 사용하였다. 고도계 관측 자료 S1과 호수 수위 자료 S는 약 8 km 떨어져 있으며, 각 위치는 Fig. 4와 같다. 수위 자료도 고도계 자료 취득 시간과 일치시킨 자료를 사용하였다.
- 고도계 자료와 수위 자료의 시계열 그래프는 Fig. 5와 같으며, RMSE는 2.4 m, 상관계수는 0.9로 나타났다. Okeowo et al. (2017)의 연구 결과와 비교하였을 때 RMSE는 0.09-1.2 m로 약 2배가량 높게 나타났지만, 상관계수는 0.61-1이었기 때문에 적정 범위로 판단된다. 호수는 수위 변화가 거의 없어 RMSE가 낮게 나타나는 편이지만, Fig. 5A의 사이클 13부터 26과 Fig. 5B의 사이클 81부터 93의 경우 겨울과 봄철 가뭄으로 저수량이 낮아졌다가 여름철 집중 호우로 수위가 급격히 높아지면서 RMSE 오차가 다른 지역에 비해 크게 발생된 것으로 추정된다.
- Sentinel-3 위성은 Jason-3 위성과 촬영 주기가 다르기 때문에 두 지역의 연구 기간이 동일하더라도 활용 가능한 자료의 수가 다르다. 따라서 육상 지역에 활용 가능한 자료가 더 많아진다면 계절 영향 등의 추세를 조금 더 명확하게 알 수 있을 것으로 판단된다.
3. 결과
- 본 연구에서는 20 Hz 고해상도 위성 고도계 자료를 이용하여 우리 나라 주변 해역 및 육상에 적용 가능한지 알아보았다. 먼저 외해의 경우 연안에서 멀어질수록 정확도가 높아지는 경향을 보였으며, 현장 자료와 비교해보아도 해수면 높이 경향성은 대체로 일치하였다. 육상의 호수의 경우에는 여름철 집중 호우로 인한 방류량에 영향을 받는 것으로 추정된다. 하지만 기존 1 Hz 해상도 고도계 자료의 경우 활용이 어려운 연안 지역, 내륙 지역에 대해 20 Hz 위성 고도계를 활용 가능할 것으로 판단된다. 또한 본 연구 방법을 활용한다면 현장 자료의 활용이 어려운 지역 및 연안 지역에서의 수문 분석의 정확도를 높일 수 있을 것이다.
4. 결론 및 토의
-
Conflict of Interest
On behalf of all authors, the corresponding author states that there is no conflict of interest.
-
Funding Information
This research was supported by the National Research Foundation of Korea (NRFK) and funded by the South Korea Government (2021R1A2C100578013), supported by the Korea Institude of Marine Science & Technology Promotion by funded the Ministry of Oceans and Fisheries through the "Development of simulation technology for maritime spatial policy" (Grant Number: 20220431), and Yonsei University Future-Leading Research Initiative (2023-22-0128).
-
Data Availability Statement
The data that support the findings of this study are available in CNES (Jason-3 altimetry) at ftp://ftp-access.aviso.altimetry.fr, in ESA (Sentinel-3A altimetry) at https://scihub.copernicus.eu/, in KHOA (Ulleungdo Island tide gauge) at http://www.khoa.go.kr/, in K-Water (Soyang Lake water level) at https://www.water.or.kr.
Notes
Supplementary Material


- Bignalet-Cazalet F, Picot N, Desai S, Scharroo R, Egido A (2021) Jason-3 Products Handbook. EUMETSAT, Darmstadt, 73p
- Dibarboure G, Boy F, Desjonqueres JD, et al (2014) Investigating short-wavelength correlated errors on low-resolution mode altimetry. J Atmos Ocean Technol 31(6):1337–1362ArticlePDF
- European Organization for the Exploitation of Meteorological Satellites (2017) Sentinel-3 SRAL Marine User Handbook. https://www-cdn.eumetsat.int/files/2020-10/S3_SRAL_marine_user_handbook.pdf Accessed 16 Aug 2023
- Okeowo MA, Lee H, Hossain F, Getirana A (2017) Automated generation of lakes and reservoirs water elevation changes from satellite radar altimetry. IEEE J Sel Top Appl Earth Obs Remote Sens 10(8):3465–3481Article
- Peng F, Deng X (2020) Validation of Sentinel-3A SAR mode sea level anomalies around the Australian coastal region. Remote Sens Environ 237:111548Article
- Quartly GD, Nencioli F, Raynal M, et al (2020) The roles of the S3MPC: monitoring, validation and evolution of Sentinel-3 altimetry observations. Remote Sens 12(11):1763Article
- Rosmorduc V, Benveniste J, Bronner E, et al (2018) Radar Altimetry Tutorial, Broadview Radar Altimetry Toolbox. European Space Agency, Paris, 356p
- Yoon HJ (2001) Comparison between In-situ data (Tide gauge) and satellite data (Topex/Poseidon) in the East Sea. In Abstracts of the Proceedings of the Korean Institute of Information and Commucation Sciences Conference, Pukyong National University, Busan, 18-19 May 2001
- Youn YH, Kim NY, Kim KH, Hwang JS, Kim JW (2002) Comparison of sea level data from Topex/Poseidon and in-situ tide gauges in the East Sea. Jour Korean Earth Science Society 23(4):349–356
References
Appendix
Meta Data for Dataset
Figure & Data
References
Citations
 PubReader
 ePub Link
 Cite
Cite


#816, 8-13, Gwangpyeong-ro 56-gil, Gangnam-gu, 06367 Seoul, South Korea
Tel: +82-2-6677-5682 E-mail: geodata@gaidas.org
Corporate registration number: 780-82-00418
