
Previous issues
- Page Path
- HOME > Articles and Issues > Previous issues
- Volume 5(3); September 2023
-


Original Papers
- Development of Machine Learning Algorithms for Riverside Land Cover Classification Using Synthetic Aperture Radar Satellite Imagery and Terrain Data
- Jaese Lee, Dukwon Bae, Young Jun Kim, Jungho Im
- GEO DATA. 2023;5(3):119-125. Published online September 25, 2023
- DOI: https://doi.org/10.22761/GD.2023.0025
- 668 View
- 67 Download
-
 Abstract
 PDF
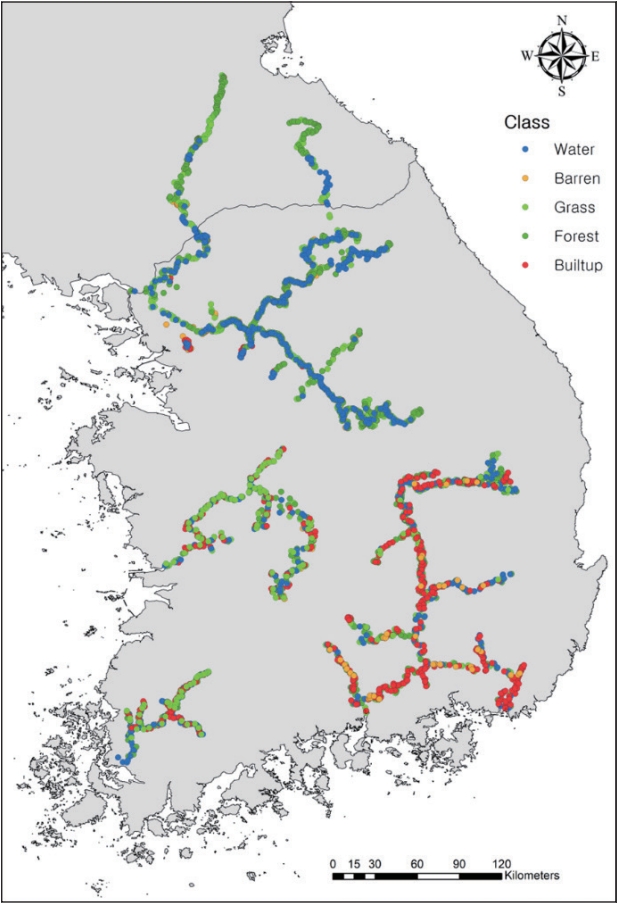
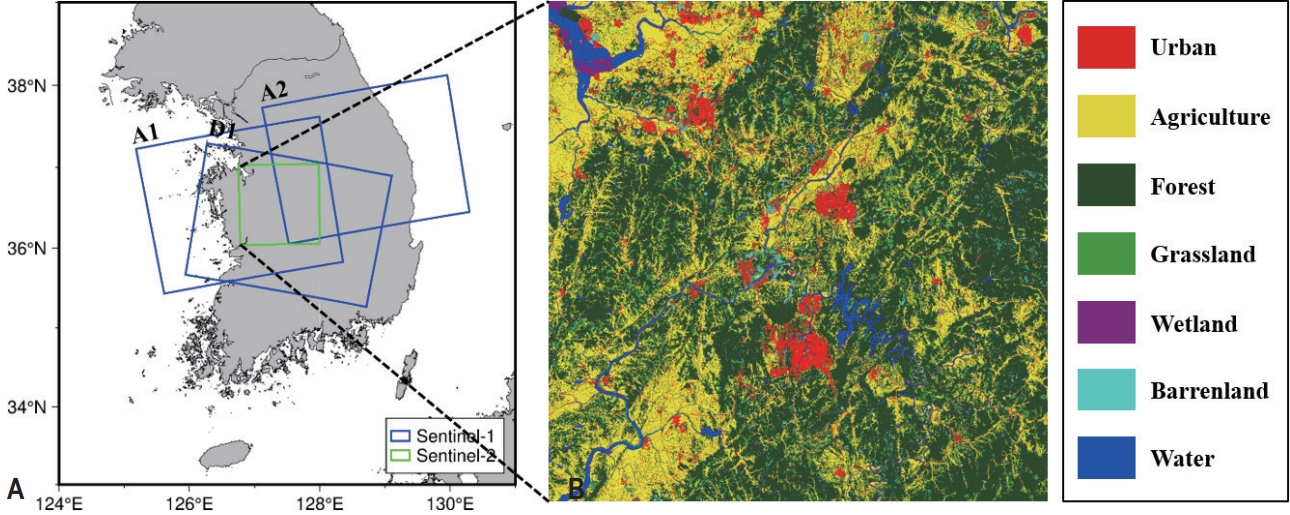
PDF - Riverine environments play a crucial role in maintaining the stability of river ecosystems as well as biodiversity. Furthermore, the appropriate management of small rivers has a significant impact not only on stable water supplies but also on water resource management. Wide monitoring of the riverside environment including land covers and their changes is an important issue in water resource management. This study aims to develop a high-resolution (10 m) model for classifying riverside land cover by integrating Sentinel-1 synthetic aperture radar (SAR) data and terrestrial characteristics using machine learning algorithms. We constructed a total of 3,284 landcover reference point datasets near the four major rivers of South Korea with five classes: water, barren, grass, forest, and built-up. The Random Forest and Light Gradient Boosting Machine classification models were developed using eight input variables derived from SAR signal and digital terrain data. The models showed an overall cross-validation accuracy exceeding 80% while maintaining consistent spatial distributions, except for the barren class. The false alarms on barren would be corrected through additional sampling processes and incorporating optical characteristics in further study. The high-resolution riverside land cover maps are expected to contribute to the establishment of a comprehensive management system for water resources such as riverside land cover change detection, river ecosystem monitoring, and flood hazard management. Furthermore, the utilization of the next generation medium satellite 5 (C-band SAR) would improve the performance of riverside land cover classification algorithm in the future.
- Improvement of Algal Bloom Identification Using Satellite Images by the Algal Spatial Monitoring and Machine Learning Analysis in a New Dam Reservoir
- Hye-Suk Yi, Sunghwa Choi, Dong-Kyun Kim, Hojoon Kim
- GEO DATA. 2023;5(3):126-136. Published online September 25, 2023
- DOI: https://doi.org/10.22761/GD.2023.0021
- 475 View
- 39 Download
-
Abstract
PDF
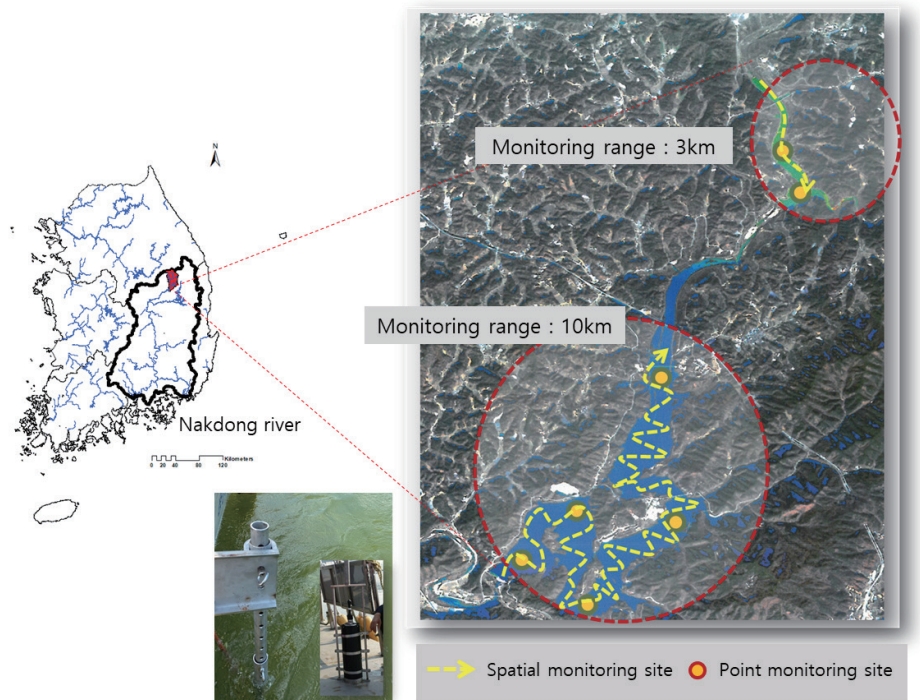
- Algal blooms are major issues and an ongoing cause of water quality problems in inland waters globally. In the case of harmful algal blooms, the water temperature rises after nitrogen and phosphorus inflow, which occurs in the summer, is the main cause of the algae bloom. In South Korea, algae monitoring methods have been performed by collecting water in point monitoring stations. Recently, in order to overcome the limitations of these existing monitoring methods, spatial monitoring methods using hyperspectral images and satellite images has been researched. We used satellite images for analysis of the spatial algal variation. The accuracy of algal identification is imperative for effective spatial monitoring of algal blooms in the context of ecological health and assessment. In this study, we generated algal big-data with simultaneously observed chlorophyll-a concentrations based on fluorescence measurement and predicted chlorophyll-a concentrations using 13- band satellite images derived from Sentinel-2. In order to validate the values from the satellite images, we compared them with simultaneously observed chlorophyll-a concentrations based on fluorescence measurement. The goal of this study is to improve the accuracy of predictions induced from satellite images. The analytical techniques were comparatively evaluated. The results showed that Artificial Neural Networks exhibited the best performance among them, improving more than 30% accuracy compared to that of multiple linear regression. Furthermore, the accuracy of identifying algal blooms has been shown to increase at high algal concentrations. In the end, it was successful to create algal bloom maps using a new algorithm to analyze algal bloom management.
- A Study on C-band Synthetic Aperture Radar Soil Moisture Estimation Based on Machine Learning Using Soil Physics, Topography, and Hydrological Information
- Jeehun Chung, Yonggwan Lee, Jinuk Kim, Wonjin Jang, Seongjoon Kim
- GEO DATA. 2023;5(3):137-146. Published online September 22, 2023
- DOI: https://doi.org/10.22761/GD.2023.0026

- 533 View
- 46 Download
-
Abstract
PDF
- In this study, we applied machine learning to estimate soil moisture levels in South Korea by harnessing data from the Sentinel-1 C-band synthetic aperture radar (SAR). Our approach incorporated not only the relationship between backscattering coefficients and soil moisture but also diverse physical characteristics. This encompassed topographic information, soil physics data, and antecedent precipitation which is a hydrological factor influencing the initial condition of soil moisture. We applied a variety of machine-learning techniques and conducted a comprehensive analysis to compare the performance of each model.
- Construction of Time-series Displacement Data of Yongdam Dam Based on PSInSAR Analysis of Satellite C-band SAR Images
- Taewook Kim, Hyunjin Shin, Jungkyo Jung, Hyangsun Han, Ki-mook Kang, Euiho Hwang
- GEO DATA. 2023;5(3):147-154. Published online September 22, 2023
- DOI: https://doi.org/10.22761/GD.2023.0024
- 558 View
- 36 Download
-
Abstract
PDF
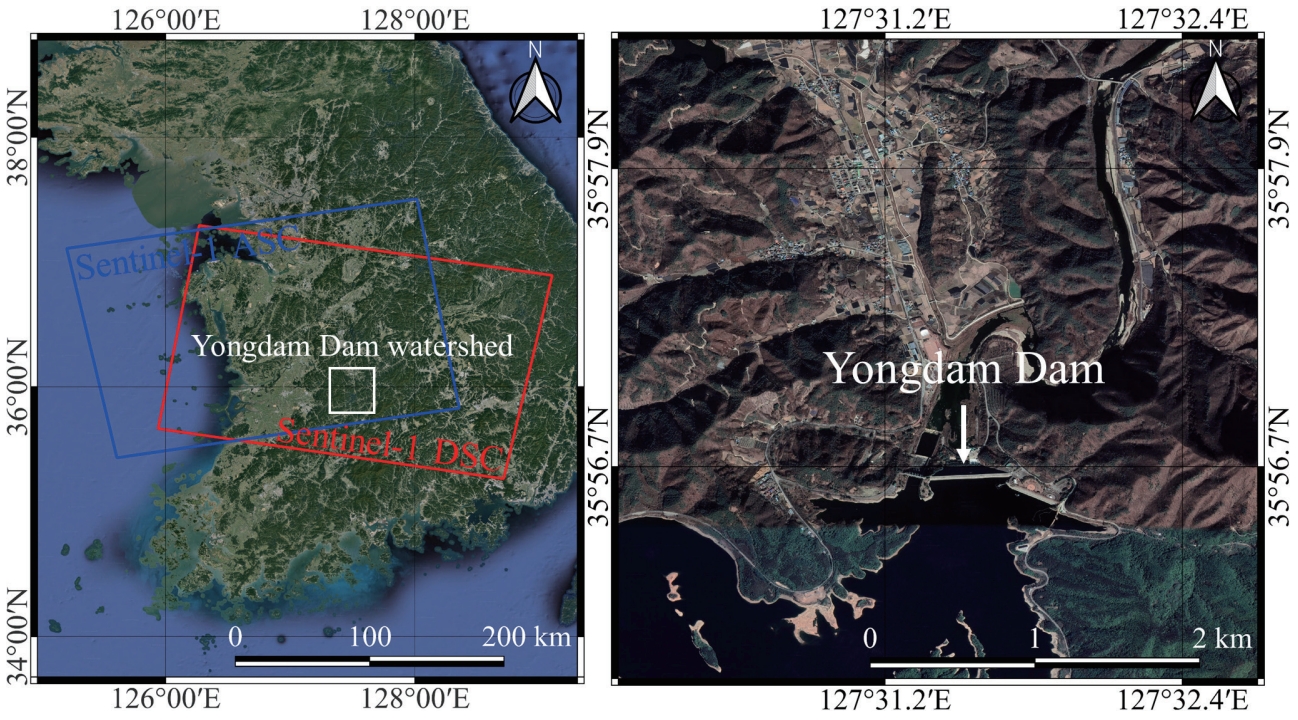
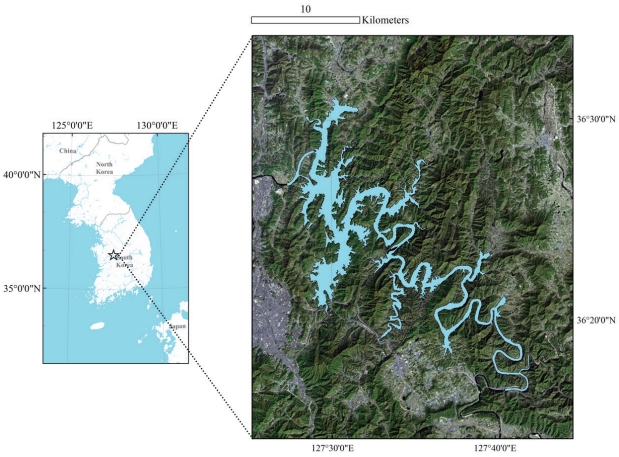
- The increase in water-related disasters due to climate change has a significant impact on the stability of water resource facilities. The displacement of a water resource facility is one of the important indicators to evaluate the stability of the facility. In this study, the time-series displacement of the Yongdam Dam was constructed by applying the persistent scatter interferometric synthetic aperture radar (PSInSAR) technique to the Sentinel-1 C-band SAR images. A sufficient number of persistent scatterers were derived to enable local deformation monitoring of the Yongdam Dam, and the dam showed very small displacement velocity except during the heavy rainfall in August 2020. In the future, C-band SAR imagery from the water resources satellite (Next Generation Medium Satellite 5) is expected to provide accurate displacement data for water resource facilities.
- Estimation of Coastal Area and Lake Water Level Changes Using High-Resolution Altimetry
- Do-Hyun Hwang, Hahn Chul Jung, Hyongki Lee
- GEO DATA. 2023;5(3):155-160. Published online September 26, 2023
- DOI: https://doi.org/10.22761/GD.2023.0030

- 505 View
- 29 Download
-
Abstract
PDF
 Supplementary Material
 - Radar satellite altimeters are widely used in offshore areas, whereas they are underutilized in coastal areas due to a number of interference factors. Altimeter satellite data can be used to summarize elevation information at 1 Hz for offshore areas, but for areas close to land, it is more effective to utilize imagery with a resolution of 20 Hz to provide a more detailed representation. The use of highresolution satellite altimeter data is expected to increase the amount of data available for hydrological data such as complex coastlines and small lakes. Therefore, in this study, we investigated the applicability of 20 Hz altimeter data in the Korean Peninsula. First, the accuracy was analyzed by comparing the 20 Hz altimeter data from the Jason-3 satellite with the Ulleungdo tide data. Second, we compared the 20 Hz altimeter data from the Sentinel-3A satellite with the water level data of Soyang Lake to see if it can be applied to land areas. In the case of inland lakes, the water level is estimated to be affected by the discharge volume due to heavy rainfall in summer, and it was determined that the satellite altimeter data can be utilized. Therefore, utilizing the data from this study is expected to improve the accuracy of hydrological analysis in coastal and lake environments.
- Energy Balance Analysis for Water Resources Satellite Operation Orbit Selection
- Jingon Bae, Shinhye Moon, Kyungsoo Kim
- GEO DATA. 2023;5(3):161-169. Published online September 27, 2023
- DOI: https://doi.org/10.22761/GD.2023.0027
- 404 View
- 22 Download
-
Abstract
PDF
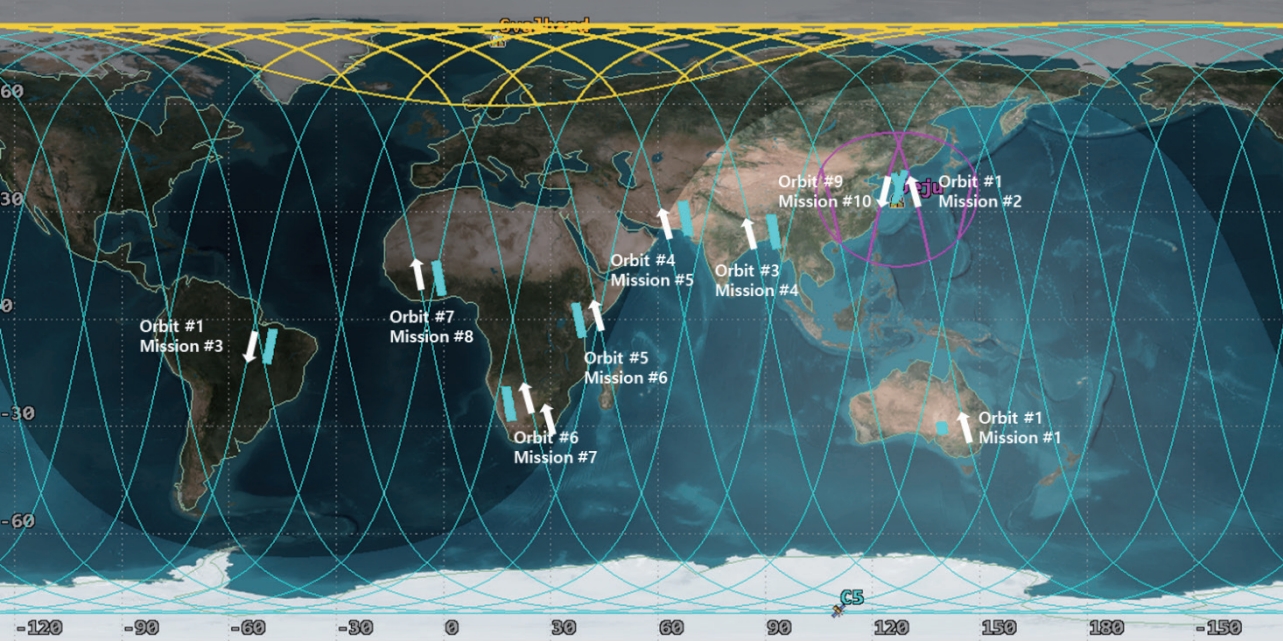
- In order to supply enough power for the satellite mission and at the same time to suppress cost increase through over-design, it is necessary to select an appropriate solar array and battery capacity. In the initial stage of satellite design, the required capacity must be analyzed to determine the solar array and battery model, which will be reflected throughout the overall satellite design. This study verifies that the CAS500 satellite platform can provide the power required for the mission in the initial stage of water resources satellite, and furthermore, it found the solar panel and battery capacity required for the water resources satellite. To this end, it was confirmed that the energy balance was satisfied by selecting the worst case one-day mission scenario of the water resources satellite under various conditions.
- Estimation of Equivalent Rainfall for Ungauged Reservoir Using Satellite-Based High-Resolution Terrain Data
- Jin Gyeom Kim, Kimook Kang, Chanyoung Son, Gibeom Nam, Euiho Hwang
- GEO DATA. 2023;5(3):170-176. Published online September 27, 2023
- DOI: https://doi.org/10.22761/GD.2023.0028
- 531 View
- 20 Download
-
Abstract
PDF
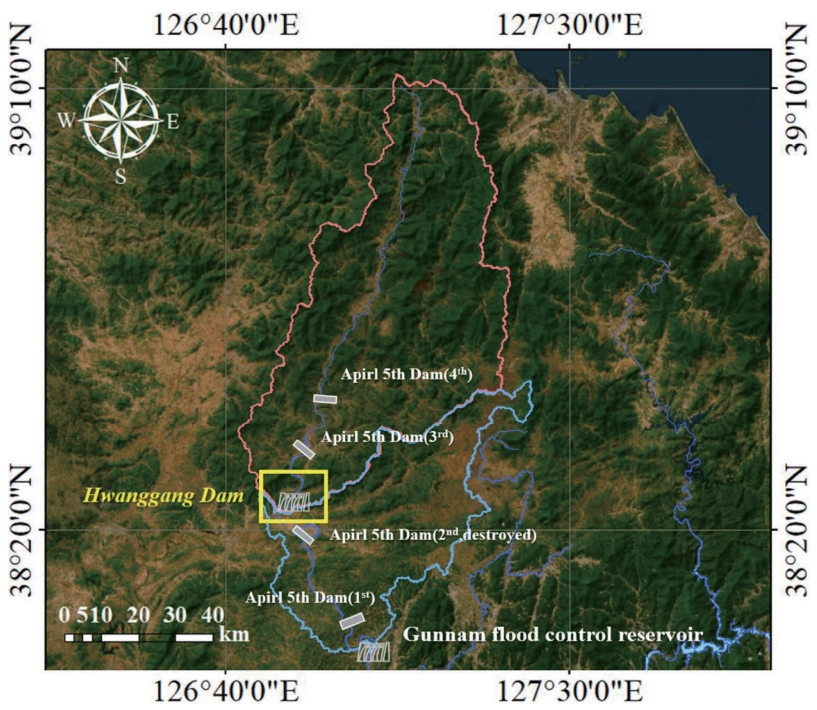
- Equivalent rainfall refers to the amount of precipitation required to reach a specific water level from the current water level in a reservoir. It serves as a flood forecasting and warning system that allows for the rapid assessment of the reservoir’s maximum water level at the moment of rainfall forecast. In reservoirs where terrain and survey data can be obtained, deriving equivalent rainfall is not difficult. However, without terrain data, satellite imagery and global topographic data are the only available options. In this study, high-resolution topographic data based on satellites were utilized to estimate the equivalent rainfall in the ungauged reservoir, Hwanggang Dam, located in the upper stream of the Imjin River in North Korea. To calculate the inflow into the reservoir, the Natural Resources Conservation Service-Curve Number method was used to determine the effective rainfall, taking into account the antecedent conditions, as the inflow into the reservoir can be changed for the same amount of rainfall depending on the soil moisture content of the watershed.
- Research on Building AI Learning Dataset for Synthetic Aperture Radar Waterbody Detection through Optical Satellite Image Fusion
- Joonhyuk Choi, Ki-mook Kang, Euiho Hwang
- GEO DATA. 2023;5(3):177-184. Published online September 27, 2023
- DOI: https://doi.org/10.22761/GD.2023.0029
- 374 View
- 17 Download
-
Abstract
PDF
- For the spatiotemporal analysis of water resources and disasters, water body detection using satellite imagery is crucial. Recently, AI-based methods have been widely employed in water body detection using satellite imagery. To use these AI techniques, a substantial amount of training data is required. When creating training data for water body detection, optical imagery and synthetic aperture radar (SAR) imagery have their respective strengths and weaknesses. To use the advantages of both, this study proposes a water body detection method through the fusion of optical and SAR imagery. The results of the proposed model show an Intersection over Union of 0.612 and an F1 score of 0.759, which is better compared to using either optical or SAR imagery alone. This research presents a method that can easily generate a large amount of water body data, making it promising for use as AI training data for water body detection.
- Detection of Floating Debris in the Lake Using Statistical Properties of Synthetic Aperture Radar Pulses
- Donghyeon Yoon, Ha-eun Yu, Moung-Jin Lee
- GEO DATA. 2023;5(3):185-194. Published online September 27, 2023
- DOI: https://doi.org/10.22761/GD.2023.0032
- 482 View
- 33 Download
-
Abstract
PDF
- This study developed the European Space Agency (ESA) Setinel-1 Ground Range Detected (GRD) time series analysis model for monitoring floating debris in lake areas through Google Earth Engine Application Programming Interface. The study aims to monitor floating debris caused by heavy rainfall efficiently. Regarding water resources and water quality management, floating debris from multipurpose dams requires continuous monitoring from the initial generation stage. In the study, a Synthetic Aperture Radar (SAR) time series analysis model that is easy to identify water bodies was developed due to low accessibility in large areas. Although SAR satellite images could be used to observe inland water environments, debris detection on water surface surfaces has yet to be studied. For the first time, this study detected floating debris patches in a wide range of lakes from GRD imagery acquired by ESA’s Sentinel-1 satellite. It demonstrated the potential to distinguish them from naturally occurring materials such as invasive floating plants. In this study, the case of Daecheong Dam, in which predicted floating debris was detected after heavy rain using Sentinel-1 GRD data, is presented. It could quickly detect various floating debris flowing into dams used as a source of drinking water and serve as a reference for establishing a collection plan.
- Riverine Bathymetry Survey Using Unmanned Aerial Vehicle-Based Multispectral Image
- Yeonghwa Gwon, Dongsu Kim, Siyoon Kwon
- GEO DATA. 2023;5(3):195-206. Published online September 27, 2023
- DOI: https://doi.org/10.22761/GD.2023.0033

- 512 View
- 22 Download
-
Abstract
PDF
- River basin surveys are conducted with the aim of providing essential foundational information for the formulation of water management policies, as mandated by relevant laws and regulations. These surveys cover key investigation areas necessary for river basin management, including basic conditions, water conveyance, dimensions, environmental ecology, and more. Among the survey methods, the utilization of remote sensing data, such as drone monitoring imagery and satellite imagery, is employed for various purposes such as the safety management of hydraulic structures like dams and embankments, water quality monitoring, river terrain surveys, and assessments of changes in riverbeds. Recently, research in river basin studies has been conducted using hyperspectral imagery, which includes hundreds of spectral bands, in addition to standard RGB imagery. Hyperspectral imagery offers the advantage of high spectral resolution, making it suitable for multi-parameter assessments. However, it comes with the drawback of large initial data volumes and complex preprocessing requirements due to the abundance of spectral information. On the other hand, multispectral imagery, which collects spectral information from fewer than ten bands, is widely used, especially in agriculture and forestry. It allows for immediate monitoring of parameters like the normalized difference vegetation index (NDVI) using just two bands and facilitates the analysis of crop growth status and more. Research on bathymetric estimation using hyperspectral imagery has traditionally relied on the Optimal Band Ratio Analysis (OBRA), which utilizes band ratios highly correlated with depth to construct bathymetric maps. In this study, we applied the existing hyperspectral bathymetric estimation technique to multispectral imagery to assess the feasibility of bathymetric estimation using reduced spectral bands. We captured multispectral imagery and constructed bathymetric maps to evaluate the applicability of multispectral imagery in river basin applications. Furthermore, to overcome the limitations of traditional OBRA, we employed Gaussian mixture models for image clustering to improve the accuracy of bathymetric estimation.
- A Study on Rice Growth Monitoring Using Drone Remote Sensing
- Jinhyeong Lee, Seungkuk Lee
- GEO DATA. 2023;5(3):207-212. Published online September 22, 2023
- DOI: https://doi.org/10.22761/GD.2023.0019

- 453 View
- 18 Download
-
Abstract
PDFSupplementary Material
- Rice paddy is one of the key crops of Korean agriculture and it has long been regarded as an important crop. Due to the high self-sufficiency of rice in Korea, the need to establish systematic rice paddy field data is increasing, and rice paddy research using remote sensing is being conducted several times in Korea. The optical satellite remote sensing method faces difficulties in data acquisition due to the abundance of clouds caused by the summer monsoon season, a characteristic of the domestic climate. However, the drone remote sensing method equipped with an optical sensor has the advantage of being able to freely acquire data, avoiding periods with high cloud cover. In this study, a drone equipped with a multispectral optical sensor was utilized to measure the height of rice paddy. Compared to satellites, drones provide the advantage of flexible timing for observations, allowing for the acquisition of high-frequency time-series data according to specific preferences. In this study, we seek to obtain values related to rice growth rates by analyzing optical data acquired through drone remote sensing. The DJI MAVIC 2 PRO drone was employed, and the Metashape program was utilized to generate a highresolution digital elevation model (DEM) from optical data. After the harvest period, rice-free rice paddy data were assumed to be digital terrain model (DTM), the height of the rice paddies. During the rice growth period, a digital surface model (DSM) was generated from drone imagery, and by calculating the difference between DSM and DTM, the height and growth of the rice plants were observed. Using network GPS measurement data, we validated monthly DEM models. This allowed us to anticipate the acquisition of precise rice growth data throughout the year, from planting to harvest.
- Climate Characteristics and Distribution of Native Organisms in Living Modified Organism Confined Field under the Ministry of Environment, Republic of Korea
- Sung Min Han, Jung Ro Lee, Kyong-Hee Nam
- GEO DATA. 2023;5(3):213-221. Published online September 26, 2023
- DOI: https://doi.org/10.22761/GD.2023.0022

- 302 View
- 13 Download
-
Abstract
PDF
- In this study, climate variables and distribution patterns of native organisms were investigated in an enclosed field within the institute of living modified organism (LMO) risk assessment designated by the Ministry of Environment (MOE) of South Korea. The data includes changes in temperature, precipitation, humidity, sunlight, wind direction, and velocity within the LMO confined field from 2019 to 2023 as well as information on plant diversity and soil microbial communities. This data can be used as the basic data when establishing LMO safety management policies by the MOE such as preparing guidelines for systematic LMO risk assessment reflecting domestic environmental characteristics and risk assessment of LMOs for environmental remediation and natural ecosystem. In addition, this data can be usefully used as the comparative data for LMO risk assessment by other ministries such as the Ministry of Agriculture, Food and Rural Affairs, the Ministry of Trade, Industry and Energy, and the Ministry of Oceans and Fisheries.
- Construction of Exploration Data for Greenhouse Gas Geologic Storage: Focusing on Geological Cross-section Data
- Bokyun Ko, Sungjae Park, Saro Lee
- GEO DATA. 2023;5(3):222-229. Published online September 26, 2023
- DOI: https://doi.org/10.22761/GD.2023.0023
- 689 View
- 66 Download
-
Abstract
PDF
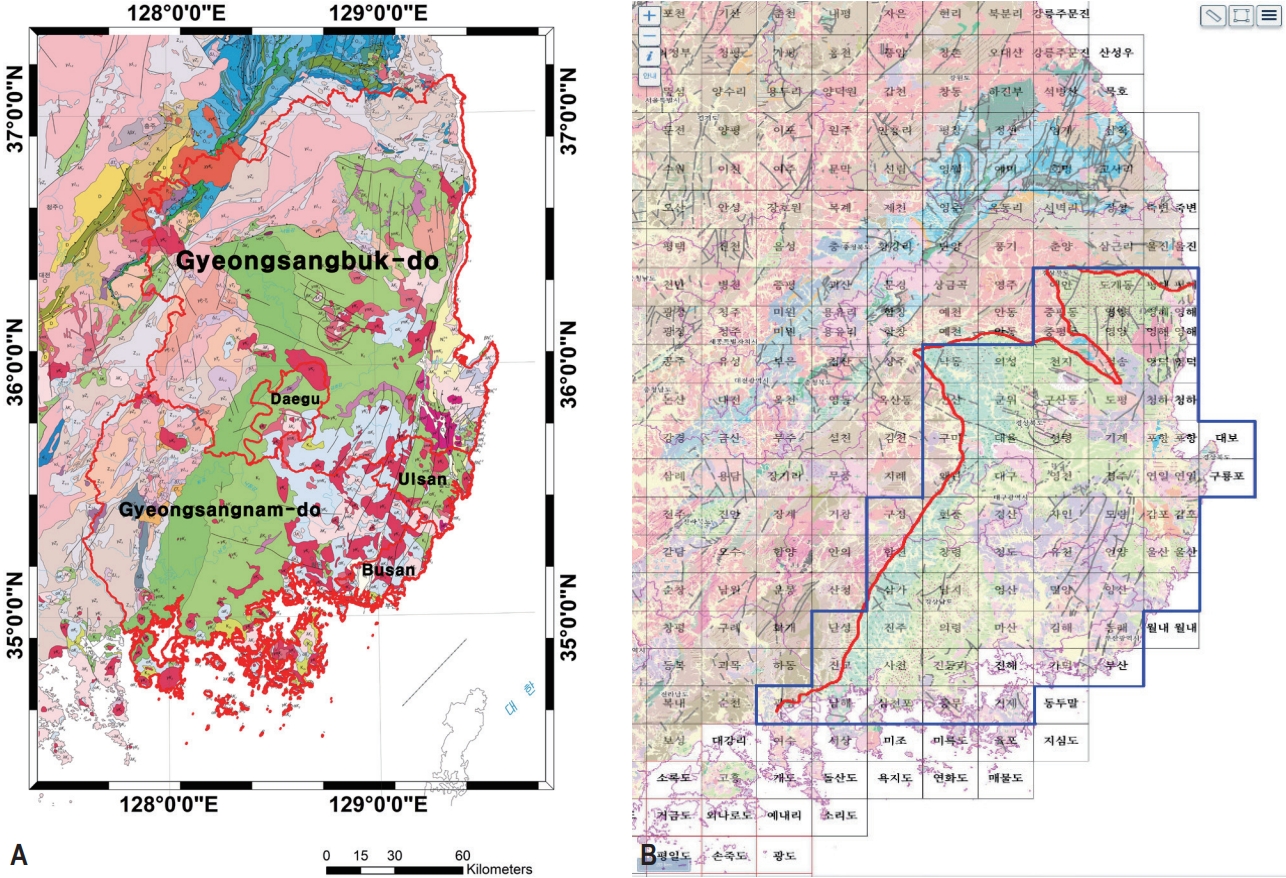
- In this study, the most basic data, underground geological structure data, that is, geological cross-section data, were established to select a candidate site for underground storage of greenhouse gases based on AI. As a target area, the Gyeongsang Basin, where a large amount of sedimentary rocks are distributed, was selected as the greenhouse gas can be stored most effectively in sedimentary rocks. To this end, the acquisition and edit step, the refinement step, and the labeling step were carried out in the order of raw data collection, source data and labeling data construction to construct the geological cross-section data. This data can be downloaded through the AI hub site (https://aihub.or.kr/aihubdata/data/view.do?curr Menu=115&topMenu=100&aihubDataSe=realm&dataSetSn=71390) operated by the Korea Institute for Intelligent Information Society Promotion.
 First
First Prev
Prev


Editorial Office of GEO DATA

#816, 8-13, Gwangpyeong-ro 56-gil, Gangnam-gu, 06367 Seoul, South Korea
Tel: +82-2-6677-5682 E-mail: geodata@gaidas.org
Corporate registration number: 780-82-00418