
Articles
- Page Path
- HOME > GEO DATA > Volume 5(3); 2023 > Article
-
Original Paper
Synthetic Aperture Radar 펄스의 통계적 특성을 이용한 호소 부유 폐기물 탐지 -
윤동현1
 , 유하은2, 이명진3,*
 - Detection of Floating Debris in the Lake Using Statistical Properties of Synthetic Aperture Radar Pulses
-
Donghyeon Yoon1, Ha-eun Yu2, Moung-Jin Lee3,*
-
GEO DATA 2023;5(3):185-194.
DOI: https://doi.org/10.22761/GD.2023.0032
Published online: September 27, 2023
1수석연구원, 서울대학교 미래혁신연구원 위성활용연구센터 지능형무인이동체연구동, 경기도 시흥시 서울대학로 173, 15011, 대한민국
2연구원, 한국환경연구원 물국토연구본부 환경계획연구실, 세종특별자치시 시정대로 370 세종국책연구단지 B동, 30147, 대한민국
3연구위원, 한국환경연구원 물국토연구본부 환경계획연구실, 세종특별자치시 시정대로 370 세종국책연구단지 B동, 30147, 대한민국
1Chef Researcher, Intelligent Unmanned Aerial Research Center, Satellite Application Research Center, Future Innovation Institute, Seoul National University, 173 Seouldaehak-ro, Siheung, 15011 Gyeonggi-do, South Korea
2Resercher, Division for Environmental Planning, Water and Land Research Group, Korea Environment Institute (KEI), Korea Environment Institute Bldg B, 370 Sicheong-daero, 30147 Sejong, South Korea
3Senior Research Fellow, Division for Environmental Planning, Water and Land Research Group, Korea Environment Institute (KEI), Korea Environment Institute Bldg B, 370 Sicheong-daero, 30147 Sejong, South Korea
- Corresponding Author Moung-Jin Lee Tel: +82-44-415-7314 E-mail: leemj@kei.re.kr
Copyright © 2023 GeoAI Data Society
This is an Open Access article distributed under the terms of the Creative Commons Attribution Non-Commercial License (http://creativecommons.org/licenses/by-nc/3.0/) which permits unrestricted non-commercial use, distribution, and reproduction in any medium, provided the original work is properly cited.
- 490 Views
- 34 Download
Abstract
- This study developed the European Space Agency (ESA) Setinel-1 Ground Range Detected (GRD) time series analysis model for monitoring floating debris in lake areas through Google Earth Engine Application Programming Interface. The study aims to monitor floating debris caused by heavy rainfall efficiently. Regarding water resources and water quality management, floating debris from multipurpose dams requires continuous monitoring from the initial generation stage. In the study, a Synthetic Aperture Radar (SAR) time series analysis model that is easy to identify water bodies was developed due to low accessibility in large areas. Although SAR satellite images could be used to observe inland water environments, debris detection on water surface surfaces has yet to be studied. For the first time, this study detected floating debris patches in a wide range of lakes from GRD imagery acquired by ESA’s Sentinel-1 satellite. It demonstrated the potential to distinguish them from naturally occurring materials such as invasive floating plants. In this study, the case of Daecheong Dam, in which predicted floating debris was detected after heavy rain using Sentinel-1 GRD data, is presented. It could quickly detect various floating debris flowing into dams used as a source of drinking water and serve as a reference for establishing a collection plan.
- 호소, 하천 및 유역 등 주요 수자원(water resources)에 부유 폐기물의 유입량은 강우량과 상관관계가 있다(Park et al., 2021). 한국의 주요 하천 상류에는 대형 다목적 댐들이 건설되어 수자원의 효율적 유지 관리 측면에서 중요한 역할을 수행하고 있다(Park et al., 2021). 집중 강우에 의한 수위의 급격한 증가로 댐 주변부에 부유 폐기물이 집중되어 수자원 및 수질 관리에 큰 어려움을 발생시키고 있다(Kim et al., 2020). 호소지역에 발생하는 부유 폐기물은 수생태계의 오염과 수질 악화와 같은 환경적 및 화학적 특성 변화를 유발하는 직접적 원인이 된다(Brito et al., 2017).
- 집중 강우로 인한 부유 폐기물 발생은 주로 낮은 접근성을 보이는 넓은 지역에 분포해 있어 위성 또는 항공영상을 이용한 조사방식에 의존한다(Hansen et al., 2007). 하지만 광학 센서 기반의 영상촬영은 기상조건에 따른 정보수집 제한이 있다. 이와 비교하여, 날씨에 영향을 받지 않는 Synthetic Aperture Radar (SAR) 영상의 환경모니터링 활용은 호소의 변화를 시계열적으로 분석하여 폐기물 발생 전후 지속해서 모니터링할 수 있다(Bates et al., 2005; Chapman et al., 2015; Mason et al., 2009; Rahman and Thakur, 2018; Sass et al., 2012).
- 기존의 SAR을 호소에 적용한 대부분의 연구는 주로 수체 경계면을 탐지하고, 침수지역을 조사하였다(Benoudjit and Guida, 2019; Irwin et al., 2017; Lee et al., 2019a; Matgen et al., 2011; Nico et al., 2000). 집중 강우 시 호수 및 하천의 부유 폐기물 위치와 태풍 등 급격한 강우량 변화에 의해 증가하는 부유 폐기물의 모니터링은 거의 고려되지 않았다(Das et al., 2015; Hu, 2021; Seo et al., 2020). 범람지역이 아닌 댐 주변의 호소의 경우 저수량을 파악하기 위한 연구가 다수였으며, 광범위한 지역에 위치한 다수의 호소를 대상으로 발표된 연구가 부족한 상황이다.
- 부유 폐기물이 발생하는 넓은 지역의 분석 및 집중 강우 등의 기상조건에 대응하기 위하여 European Space Agency (ESA) Sentinal-1 SAR 영상을 활용하여 시계열 분석 모델을 개발하였다. 기존 SAR 영상을 활용한 연구는 영상처리나 해석이 복잡하여 많은 시간이 소요된다(Lee et al., 2019b; Lee et al., 2021). 그러나 최근 제안된 빅데이터를 활용한 시공간 분석 플랫폼 중 600여 개의 위성자료를 무료로 제공하는 Google Earth Engine을 이용하여 즉각적인 수재해 피해 탐지와 중장기적 시계열 관측이 가능하다(Park and Kang, 2022). 본 연구는 홍수 및 범람에 따른 수재해와 더불어 중요 식수원 중 하나인 다목적 댐의 수질 관리를 위해 Google Earth Engine Application Programming Interface (GEE API)를 활용한 SAR 영상의 시계열 탐지모델을 제시하여 호소지역 부유 폐기물 모니터링에 대한 접근성을 높이고자 하였다. SAR 영상이 특정 확률 분포 함수를 따른다는 가정을 설정하고, 확률 분포 함수의 차이에서 부유 폐기물과 수표면의 산란 특징을 통계적 추정방법으로 구분하고자 한다. 부유 폐기물 발생 전의 시계열 SAR 영상을 전술된 가정에 적용하고 공간적으로 부유 폐기물을 모니터링하는 방법을 제시하였다.
1. 서론
- 2.1 연구지역
- 연구 대상지인 대청호는 Fig. 1에 나타냈다. 대한민국의 내륙 중심에 위치하고 있으며, 대전 도심에서 동북쪽으로 16 km 떨어진 금강 상류지역에 건설한 표면적 72.8 km2, 저장 용량 1.49 km3를 가지는 저수지이다. 대청호에서 공급되는 생활 및 공업용수는 연간 1.3 km3로 충청도, 대전광역시, 전라북도에서 식수로 사용되고 있다(K-water, 2023).
- 연구지역 현황 및 폐기물 발생현황 파악을 위해 2013년부터 2020년 사이의 환경부 폐기물 관련 자료를 Table 1에 정리하였다(Ministry of Environment, 2019; Ministry of Environment, 2020). 대청호는 2013년부터 2020년 56,396톤의 부유 폐기물이 발생한 지역이다(Ministry of Environment, 2018; Ministry of Environment, 2020). 홍수기에 대청댐 유입된 부유물은 연평균 약 10,000톤이며, 강우에 따른 발생량은 해마다 상이하게 관찰된다. 대량으로 부유 폐기물이 발생한 2018년의 경우 약 15,000 m3의 폐기물이 유입되었는데, 주로 하천변에 있던 초목류로 구성되어 있으며 나머지는 둔치 등에서 발생된 생활 쓰레기로 추정된다(Ministry of Environment, 2019). Sentinel-1 영상 목록과 부유 폐기물의 발생 현황을 파악할 수 있는 2020년을 대상으로 탐지 알고리즘을 실험하였다.
- 2.2 연구자료
- Sentinel-1 SAR 데이터는 C 대역(5.3 GHz/5.7 cm)에서 작동하며 해상도는 10×10 m이고 관측 범위는 약 250 km이다(Bourbigot et al., 2016). Google Earth Engine의 Sentinel-1 내에서 모든 영상은 Sentinel-1 Toolbox (S1TBX)에 의해 전처리된 Sentinel-1 ground range detected, high resolution (GRDH) 영상이다(Earth Engine Data Catalog; European Union/ESA/Copernicus, 2014). 연구에 사용된 자료는 2020년 6월부터 9월까지 집중 강우 기간 대한민국 대청호 자료이며, 부유 폐기물을 대상으로 연구를 진행하였다(Table 2). Table 2 Sentinel-1의 상대 궤도 수(relative orbit number)는 단일 위성에 대한 12일 반복 주기 및 175개의 태양 동기 궤도이다(European Union/ESA/Copernicus, 2022). 본 연구에서 는 ascending 127과 descending 134 상대 궤도 수를 사용하였다.
2. 연구지역 및 자료
- 3.1 부유 폐기물 탐지를 위한 가설 설정
- 호수의 부유 폐기물을 분류하는 기술적 가설은 수표면과 부유 폐기물에 대한 C-Band SAR 후방산란 강도의 유의미한 차이가 발생할 것이라는 것을 가정한다. 첫째, Fig. 2와 같이 Sentinel-1 영상에서 수표면은 반사광으로 간주되며 VV 편광 대역으로부터 약 -17 to 18 dB 이하의 후방산란 강도를 특징으로 한다(Gulácsi and Kovács, 2020). 둘째, 연속된 시계열에서 호소 수표면의 후방산란 강도 변화가 육상보다 상대적으로 적을 것을 가정하였다. 셋째, 집중 강우로 호소 주변에서 유입된 부유 폐기물은 수표면 레이더파의 후방산란 신호 강도의 변화를 나타낼 것이다 이때, 호소의 표면에서 파랑보다 폐기물에 의한 신호 강도 변화가 더 클 것으로 가정하여 Amplitude Change Detection (ACD) 기법을 적용하였다.
- ACD 모델은 Conradsen et al. (2016)의 공분산 행렬 멀티룩 SAR 변화 탐지(covariance matrix multilook SAR change detection) 이론을 기반으로 수행되 다. SAR 신호는 공분산 행렬 형태로 표현될 수 있으며, 공분산 행렬은 equivalent number of looks (ENL) 기반한 위샤트 분포(Wishart distribution)을 따른다(Canty et al., 2020; Lee and Grunes, 1992; Nielsen et al., 2017; Rajan, 2017). Anfinsen et al. (2009)의 SAR ENL 에 대한 추정기(estimators)를 참고하여 연구를 진행하였다. Anfinsen et al. (2009)에서는 멀티룩 편광 복합체(multilook polarimetric complex)의 분산-공분산 행렬(variance-covariance matrix)과 위샤트 분포 함수의 모멘트(moments of functions of Wishart distributed)에 기반하여 추정기(estimators)를 개발하였다. 이 연구에서도 Sentinel-1 GRDH 신호가 동일한 통계적 특성을 가진다는 가정 아래에 연구를 진행하였다.
- 3.2 ACD 기반 부유 폐기물 탐지
- 부유 폐기물에 따른 신호 강도 변화 탐지를 위해 집중 강우 기간 동안 호소의 표면에서 부유 폐기물이 시계열에서 발견되지 않았다는 귀무가설 H0을 기각하고 최소한의 변화(p-values)가 발생했다는 대안가설 H1을 Conradsen et al. (2016)이 제시한 우도비(likelihood)로 평가한다. 이는 모든 시계열 복소 분산-공분산 행렬(complex variancecovariance matrix)의 모든 행렬 유사성을 평가하는 총괄 검정(omnibus test)이다(Nielsen et al., 2017).
- 연구의 전반적인 흐름도는 Fig. 3에 도시하였으며, 2.2 연구자료에서 전술한 S1TBX에 의한 전처리는 궤도 보정, 경계 잡음 제거, 열 잡음 제거, 방사보정, 지형 보정이다. 전처리 된 GRDH 영상은 다변량 정규분포(multivariate normal distribution)의 표본에 대한 공분산 행렬로 나타날 수 있다. 연속된 시계열에서 변화를 탐지하기 위한 복소 분산-공분산 행렬에 대한 우도비 테스트에서 귀무가설을 기각할 수 있는 경우는 호수에 SAR 진폭 강도(amplitude intensity) 변화가 있었음을 의미한다. Conradsen et al. (2016) 모델을 기반으로 데이터셋 각 시점의 모든 픽셀에 대한 탐지 패턴을 구축하여 부유 폐기물을 식별하였다. 예를 들면 μi=⋯μi+6열에서 μi+2열의 영상과 μi+3 영상을 비교하여 변화가 나타나면 해당 배열의 나머지 통계량 테스트는 유효하지 않으므로 대안가설을 기각한다. 이후 μi+3열부터 통계량 테스트를 반복적으로 진행한다. 이 과정을 통해 모든 데이터셋의 각 시점에 걸쳐 모든 픽셀에 대한 탐지 패턴을 구축하였다.
- 가설검증에 있어 연속된 시계열(k) 데이터셋의 유의 수준이 α일 때, 1종 오류(false positive) 발생 확률 αp은 1-(1-α)k-1이다. 각 데이터셋이 독립적이지 않기 때문에 시계열 데이터셋의 유의수준(α)은 매우 작은 차이에서도 큰 차이의 결과로 나타날 수 있다. 예를 들어 시계열 k=15의 데이터셋에서 유의수준(α)을 0.05라고 가정한다면 1종 오류 발생 확률(αp)은 51.23%이다. 이러한 가정에서 1종 오류 발생 확률(αp)을 1% 미만으로 낮추기 위해서는 α≈1-k-1√1-α 수식에 따라 α≈0.00071과 같이 극단적으로 낮게 설정해야 한다. 유의 확률 p값(p-value)이 유의수준(α)보다 작을 때, 귀무가설을 기각하고 호수 수표면의 신호 변화를 근거로 부유폐기물을 탐지하였다.
- 2020년에 발생한 부유 폐기물 발생 이벤트에서 1종 오류 허용범위를 αp≤0.1%로 설정하였으며 k=13 시계열에서 αk=13≈8.337e-05를 인수로 하였다. 2020년 6월 1일부터 9월 30일까지 Sentinel-1 ascending, descending 데이터셋으로 구성하여 연구를 진행하였다.
3. 연구 방법
- 4.1 결과
- 일일 강수량이 약 100 mm인 일자에서 신호 강도 변화에 따른 면적 결과의 증가 패턴을 확인할 수 있다(Table 3). 일일 강수량 99.5 mm인 2020년 6월 14일 0.47 km2 면적의 부유 폐기물이 발생한 것으로 분석되었다. 집중 호우 기간으로 보여지는 2020년 8월 1일(219.5 mm), 8월 7일(153.5 mm), 8월 13일(178.5 mm)에 일일 증가 부유 폐기물 면적은 전술된 날짜별 1.598 km2, 2.251 km2, 1.321 km2로 나타났다. 마지막으로 2020년 8월 31일(118 mm), 9월 6일(111.5 mm)강우가 발생하자 1.293 km2, 4.003 km2 면적의 대량 부유 폐기물이 발생한 것으로 탐지되었다.
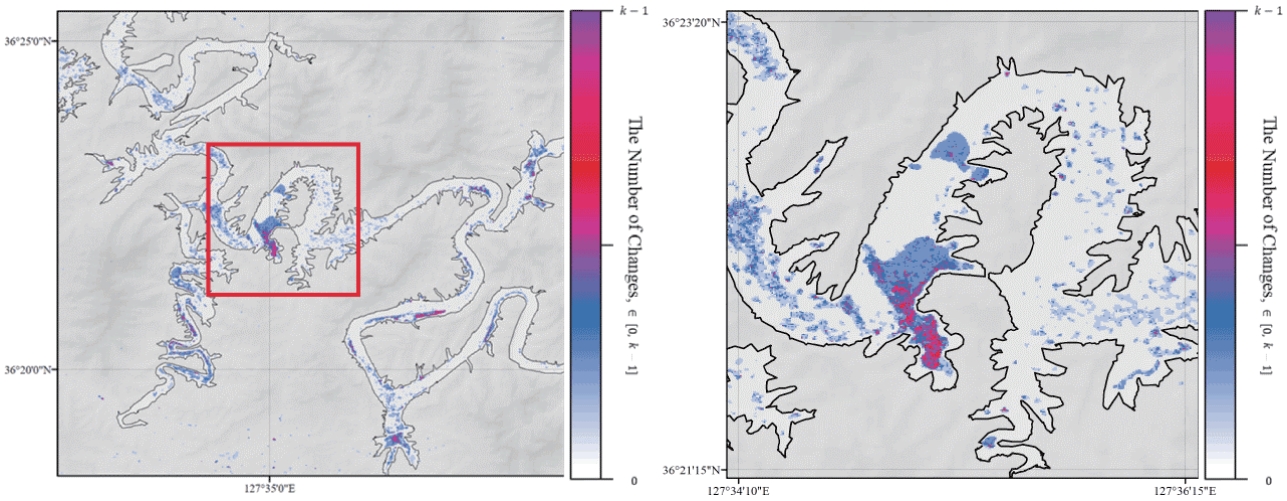
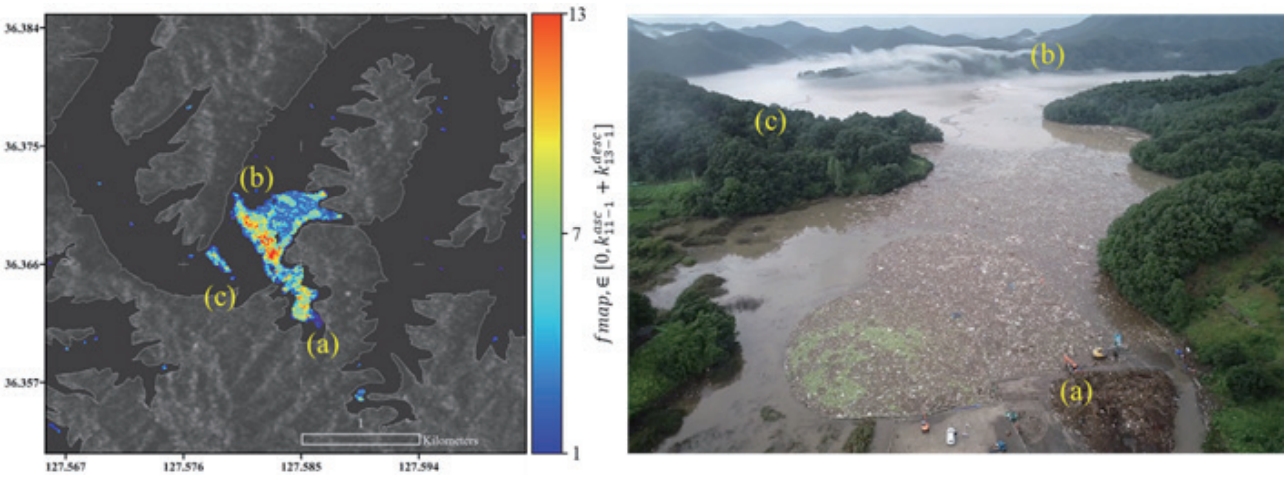
- 현장 검증을 통해 연구 대상지인 대청호에서 탐지된 부유 폐기물은 경사지와 농촌 거주지역이 인접하여 있으며 유속 변화가 발생하는 병목지점으로 나타났다(Figs. 4, 5). Figs. 4, 5의 석호리 지역은 대청호의 동쪽 부분으로 연구 조사 기간에 최대 6회 부유 폐기물이 발생하였으며, 집중 강우 시기 동안 반복적으로 발생했다. Fig. 4는 descending 자료에 대해 k=13 시계열에서의 변화량을 나타낸 것이다. 같은 지역의 ascensing과 descending 자료 데이터셋을 혼합하여 이 시기에 발생한 부유 폐기물의 면적 변화와 현장 사진은 Fig. 5와 같다. 부유 폐기물이 다수 발생하는 지역의 현장에서 Fig. 5의 (b)의 차단막 시설을 확인하였는데, 병목 지형과 함께 부유 폐기물 면적을 증가시키는 요인이라 사료된다.
- 4.2 토의
- 본 연구는 영상레이더의 ACD 기반 부유 폐기물 모니터링 알고리즘으로 지표면의 신호 강도 변화 정도를 정량적으로 추출하는 데 목적이 있다. 이에 대해 집중 강우와 같이 부유 폐기물 유발 요인의 객관적 지표와 인식 가능한 신호특성을 확인하였다. 파랑이 적은 호소는 C-Band에서 정반사(specular scattering)하는 특성을 가지는 반면 부유 폐기물과 같은 혼합 응집체는 후방산란 신호 강도가 증가하는 것으로 나타났다(Hwang et al., 2021; Kodis, 1966). 기술적 가설과 관련하여 대청호의 신호 강도 차이가 부유 폐기물이며, 수표면의 신호 강도 차이로 이를 식별하는 것이 가능한 것을 확인할 수 있었다.
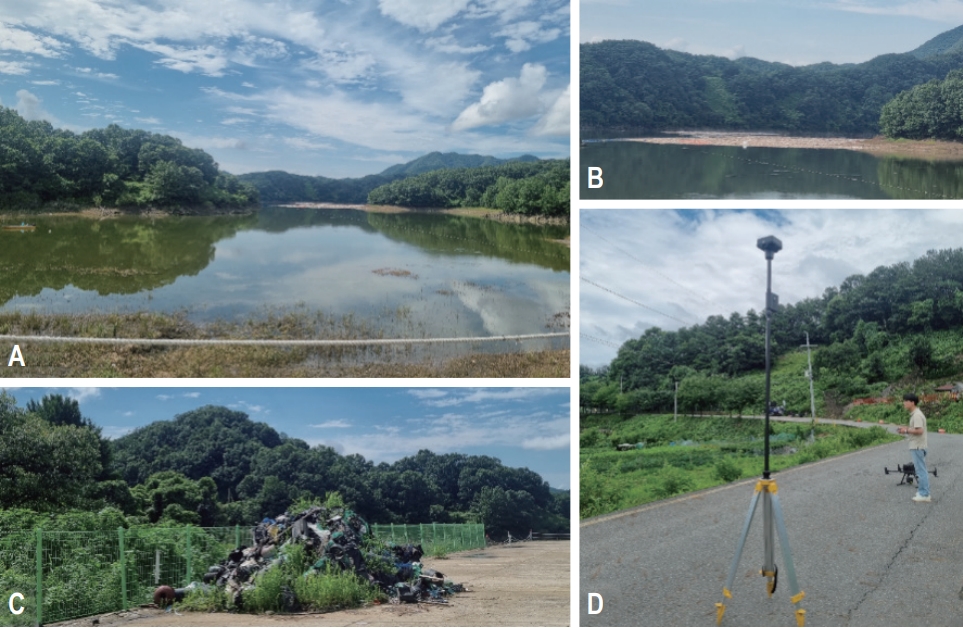
- 모델은 GEE API를 기반으로 개발되었으며 2020년 Sentinel-1의 산란 패턴을 기반으로 부유 폐기물 탐지 결과를 분석하였다. 현장에서 촬영된 사진영상자료를 기반으로 식별된 부유 폐기물의 위치와 시간 정보를 이용하여 탐지 결과 검증을 진행하였다. 향후 연구와 관련하여 2023년 7월 24일 익일 전 집중 강우로 부유 폐기물이 발생한 대청호에 방문하여 드론 촬영을 진행하였다(Fig. 6D). 호소 수표면에서 부유 폐기물을 관찰할 수 있었고, 일부 부유 폐기물들은 수거된 것을 확인하였다(Fig. 6A-C). 향후 연구는 2023년 집중 강우 시기 자료를 이용한 SAR 시계열 분석모델의 부유 폐기물 탐지 결과와 집중 강우로 인한 부유탐지물의 드론 촬영영상의 공간 분포 비교를 진행하고자 한다.
4. 결과 및 토의
- 호소에서 집중 강우 후 발생하는 부유 폐기물 모니터링을 위해 ACD 변화탐지 기법을 기반으로 유의지수 추정함수를 제안하였다. 2020년 6월부터 9월까지 집중 강우 시기에 대한 적용실험을 수행하였다. 이 기간 동안 부유 폐기물의 일일 발생량에 대해 최소 0.024 km2, 최대 4.003 km2의 신호 변화 면적이 계산되었다. 부유 폐기물은 폐기물 차단막과 같은 장치에 의해 특정 지역에 모이는 것을 확인할 수 있었고, 대청호 상류 및 중류 구간에 발생한 부유 폐기물은 석호리 일대의 폐기물 수거시설을 통해 수집되는 것으로 탐지되었다.
- 식수원으로 활용되는 중요 수자원인 호소에서 유입되는 각종 폐기물을 빠르게 탐지하고 수거계획을 수립하기 위해서는 호수의 주요 지점의 상시 관리가 필요하다. 본 연구에서 제안하는 부유폐기물 모니터링 방법은 모든 호소에 적용할 수 있을 뿐만 아니라, 위성영상의 특성상 적은 비용으로 광대한 지역을 모니터링할 수 있다. 더불어 주요 하천과 호수에 유입되는 폐기물 관리 정책에 유용한 수단이 될 수 있을 거라 사료된다. 결과적으로 폐기물 모니터링을 통한 예방대책의 실효성을 높임으로써 부유 폐기물 처리비용을 절감할 수 있다. 또한, 제안하는 방법의 신뢰성 확보와 부정효과를 유발하는 바람, 파랑에 의한 노이즈가 개선된다면 호소 이외에도 하천과 하천 하류에서 해양으로 유입되는 폐기물의 모니터링에서도 활용할 수 있을 것이다.
5. 결론
-
Acknowledgements
- We gratefully acknowledge the technical cooperation of the Water Resources Satellite Center, Korea Water Resources Corporation (K-water) Institute.
-
Conflict of Interest
On behalf of all authors, the corresponding author states that there is no conflict of interest.
-
Funding Information
This paper is supported by the Korea Environment Institute (KEI)'s 2023 Basic Research Project, "Data-based National Carbon Sink Conversion Research for Carbon Neutrality Practice" (RE2023-08). It is based on the results of the project (2023-14(R)) conducted by the KEI with the support of the Ministry of the Interior and Safety's Natural Disaster Policy-Linked Technology Development Project (2020-MOIS35-001 (RS-2020-ND629021)).
-
Data Availability Statement
The data that support the findings of this study are available on request from the corresponding author. The data are not publicly available due to privacy or ethical restrictions.
Notes


- Anfinsen SN, Doulgeris AP, Eltoft T (2009) Estimation of the equivalent number of looks in polarimetric synthetic aperture radar imagery. IEEE Trans Geosci Remote Sens 47(11):3795–3809Article
- Bates PD, Horritt, MS, Cobby D, Mason D (2005) Flood inundation modelling using LiDAR and SAR data. In: Kelly REJ, Drake NA, Barr SL (eds) Spatial modelling of the terrestrial environment. John Wiley & Sons, Inc, Hoboken, pp 79-106
- Benoudjit A, Guida R (2019) A novel fully automated mapping of the flood extent on SAR images using a supervised classifier. Remote Sens 11(7):779Article
- Bourbigot M, Johnsen H, Piantanida R (2016) Sentinel-1 product definition. ESA unclassified-for official use. https://sentinel.esa.int/documents/247904/1877131/Sentinel-1-Product-Definition Accessed 11 Sep 2023
- Brito BC, Forsberg BR, Kasper D, et al (2017) The influence of inundation and lake morphometry on the dynamics of mercury in the water and plankton in an Amazon floodplain lake. Hydrobiologia 790:35–48ArticlePDF
- Canty MJ, Nielsen AA, Conradsen K, Skriver H (2019) Statistical analysis of changes in Sentinel-1 time series on the Google earth engine. Remote Sens 12(1):46Article
- Chapman B, McDonald K, Shimada M, et al (2015) Mapping regional inundation with spaceborne L-band SAR. Remote Sens 7(5):5440–5470Article
- Conradsen K, Nielsen AA, Skriver H (2016) Determining the points of change in time series of polarimetric SAR data. IEEE Trans Geosci Remote Sens 54(5):3007–3024Article
- Das S, Kar NS, Bandyopadhyay S (2015) Glacial lake outburst flood at Kedarnath, Indian Himalaya: a study using digital elevation models and satellite images. Nat Hazards 77:769–786ArticlePDF
- European Union/ESA/Copernicus (2014) Sentinel-1 SAR GRD: C-band synthetic aperture radar ground range detected, log scaling. European Union/ESA/Copernicus. https://developers.google.com/earth-engine/datasets/catalog/COPERNICUS_S1_GRD Accessed 11 Sep 2023
- European Union/ESA/Copernicus (2022) The Sentinel-1 Toolbox. European Space Agency. https://sentinel.esa.int/web/sentinel/toolboxes/sentinel-1 Accessed 11 Sep 2023
- Gulácsi A, Kovács F (2020) Sentinel-1-Imagery-based highresolution water cover detection on wetlands, aided by Google Earth engine. Remote Sens 12(10):1614Article
- Hansen M, Howd P, Sallenger A, Wright CW, Lillycrop J (2007) Estimation of post-Katrina debris volume: an example from coastal Mississippi. In: Farris GS, Smith GJ, Crane MP, et al (eds) Science and the storms: the USGS response to the hurricanes of 2005. U.S. Geological Survey, Reston, pp 43-48
- Hu C (2021) Remote detection of marine debris using satellite observations in the visible and near infrared spectral range: challenges and potentials. Remote Sens Environ 259:112414Article
- Hwang PA, Ainsworth TL, Ouellette JD (2021) Microwave specular measurements and ocean surface wave properties. Sensors 21(4):1486ArticlePubMedPMC
- Irwin K, Beaulne D, Braun A, Fotopoulos G (2017) Fusion of SAR, optical imagery and airborne LiDAR for surface water detection. Remote Sens 9(9):890Article
- Kim SW, Cho YH, Chae MH, Kil GB, Seok KS (2020) Characteristics of organic matters in small streams into the Daecheong reservoir. J Environ Anal Health Toxicol 23(3):155–164ArticlePDF
- Kodis R (1966) A note on the theory of scattering from an irregular surface. IEEE Trans Antennas Propag 14(1):77–82Article
- K-water (2023) Water Safety Services. K-water. https://www.kwater.or.kr/eng/busi/resoPage.do?s_mid=1179 Accessed 11 Sep 2023
- Lee D, Cheon EJ, Yun H, Lee MH (2019a) A study on water surface detection algorithm using Sentinel-1 satellite imagery. Korean J Remote Sens 35(5_2):809–818
- Lee JS, Grunes MR (1992) Classification of multi-look polarimetric SAR data based on complex Wishart distribution. In: NTC 1992 National Telesystems Conference, Washington DC, 19-20 May 1992
- Lee K, Jeon SG, Seong SY, Kang KM (2021) Technology trend in synthetic aperture radar (SAR) imagery analysis tools. J Space Technol Appl 1(2):268–281ArticlePDF
- Lee KW, Kim KS, Lee SG, Kim YS (2019b) Consideration points for application of KOMPSAT data to open data cube. J of the Korean Assoc of Geogr Inf Stud 22(1):62–77
- Mason DC, Speck R, Devereux B, et al (2009) Flood detection in urban areas using TerraSAR-X. IEEE Trans Geosci Remote Sens 48(2):882–894Article
- Matgen P, Hostache R, Schumann G, Pfister L, Hoffmann L, Savenije HHG (2011) Towards an automated SAR-based flood monitoring system: Lessons learned from two case studies. Phys Chem Earth 36(7-8):241–252Article
- Ministry of Environment (2018) Press release. Ministry of Environment. http://www.me.go.kr/home/web/board/read.do?boardMasterId=1&boardId=907490&menuId=286 Accessed 11 Sep 2023
- Ministry of Environment (2019) Environmental policy. Ministry of Environment. https://www.me.go.kr/home/web/policy_data/read.do?menuId=10259&seq=7394 Accessed 11 Sep 2023
- Ministry of Environment (2020) Press release. Ministry of Environment. https://me.go.kr/home/web/board/read.do?boardMasterId=1&boardId=1391020&menuId=286 Accessed 11 Sep 2023
- Nico G, Pappalepore M, Pasquariello G, Refice A, Samarelli S (2000) Comparison of SAR amplitude vs. coherence flood detection methods-a GIS application. Int J Remote Sens 21(8):1619–1631
- Nielsen AA, Conradsen K, Skriver H, Canty MJ (2017) Change detection in a series of Sentinel-1 SAR data. In: Proceedings of the 2017 9th international workshop on the analysis of multitemporal remote sensing images (MultiTemp), Institute of Electrical and Electronics Engineers, Inc., Brugge, 27-29 June 2017
- Park JS, Kang KM (2022) Research of water-related disaster monitoring using satellite bigdata based on Google Earth engine cloud computing platform. Korean J Remote Sens 38(6-3):1761–1775
- Park Y, Kim SH, Chon K, et al (2021) Impacts of heavy rain and floodwater on floating debris entering an artificial lake (Daecheong Reservoir, Korea) during the summer. Desalin Water Treat 219:399–404Article
- Rahman MR, Thakur PK (2018) Detecting, mapping and analysing of flood water propagation using synthetic aperture radar (SAR) satellite data and GIS: a case study from the Kendrapara district of Orissa state of India. Egypt J Remote Sens Space Sci 21:S37–S41Article
- Rajan D (2017) Probability, random variables, and stochastic processes. In: Serpedin E, Chen T, Rajan D (eds) Mathematical foundations for signal processing, communications, and networking. CRC Press, Boca Raton, pp 205-244
- Sass GZ, Wheatley M, Aldred DA, Gould AJ, Creed IF (2012) Defining protected area boundaries based on vascular-plant species richness using hydrological information derived from archived satellite imagery. Biol Conserv 147(1):143–152Article
- Seo S, Park YG, Kim K (2020) Tracking flood debris using satellitederived ocean color and particle-tracking modeling. Mar Pollut Bull 161:111828ArticlePubMed
References
Appendix
| Sort | Field | Subcategory#1 | Subcategory#2 |
|---|---|---|---|
| Essential | *Title | Result of change detection using SAR Radar pulses | |
| *DOI name | https://github.com/KEI-EnvironmentalPlanning/SAT_FloatingDebris | ||
| https://doi.org/10.22761/GD.2023.0032 | |||
| *Category | Environment | ||
| Abstract | - | ||
| *Temporal Coverage | 4 months | ||
| *Spatial Coverage | Address | Google Earth Engine | |
| Korea 2000 Korea Central Belt 2010 | Polygon | ||
| Lat: 35.39 to 35.53 | |||
| Lon: 126.51 to 126.78 | |||
| *Personnel | Name | Moung-Jin Lee | |
| Affiliation | Korea Environment Institute | ||
| leemj@kei.re.kr | |||
| *CC License | CC BY-NC | ||
| Optional | *Project | - | |
| *Instrument | SNAP 9.0.0 | ||
| MATLAB R2023a | |||
| ArcGIS 10.1 |
Figure & Data
References
Citations
 PubReader
 ePub Link
 Cite
Cite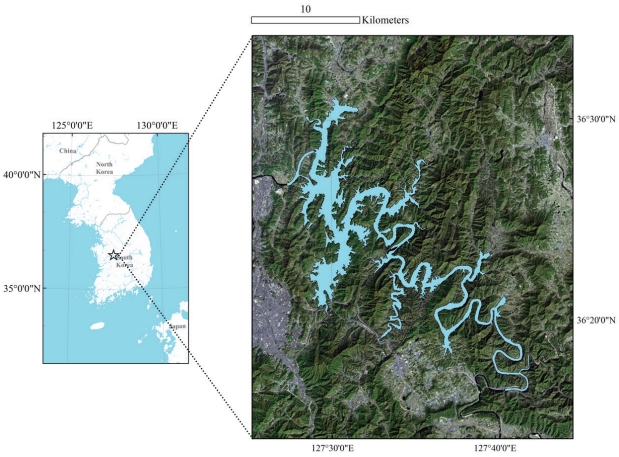


#816, 8-13, Gwangpyeong-ro 56-gil, Gangnam-gu, 06367 Seoul, South Korea
Tel: +82-2-6677-5682 E-mail: geodata@gaidas.org
Corporate registration number: 780-82-00418
